Related Articles

Although I’m going to be writing about horse racing throughout the rest of this article, the principles I’m writing about hold true across all forms of sports betting. In fact they hold true across all forms of data analysis.
It’s a known fact that for most people it’s easier to absorb knowledge that is displayed in a graphical manner. It’s for this reason that the world we know is developing into a media based culture. Everywhere you look there are images and videos, and the amount of text and numerical information is being reduced.
When we look at horse racing information all we see is numbers. If you are using a website such as the Racing Post then there are more graphics, but the overwhelming impression is still of numbers.
We see form figures, age, weight, days since last run, weight, OR, TS, RPR and odds. And, that’s just the basic information.
Most of the numbers provided both by the racing industry and by private companies are unexplained anywhere, which is actually something I feel needs to be of priority in the world of horse racing if it’s going to gain more followers. But that is for another article!
When we start getting into more advanced analysis, the quantity of different numbers rapidly increases. Personally I calculate my own factors and there are hundreds which get combined in different ways depending on race conditions.
In this article I want to look at an approach to visualising this information in order to more quickly assimilate the information we are looking at.
The first question that we must ask ourselves is whether it is really true that visualising data can allow us to interpret it faster than seeing numerical values on paper.
The best way to do this is with an experiment.
Look at the ratings below:
Horse A – 75, 87, 28, 66, 78, 76, 60
Horse B – 27, 66, 106, 34
Now move on to the next page and take a look at the graphs.
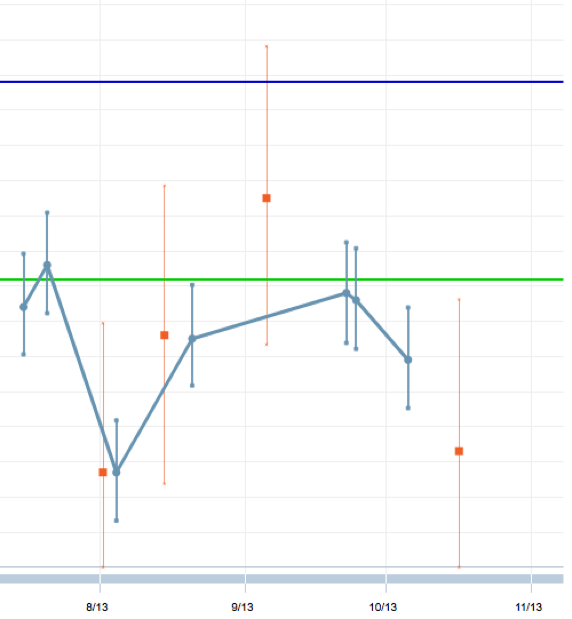
Horse A
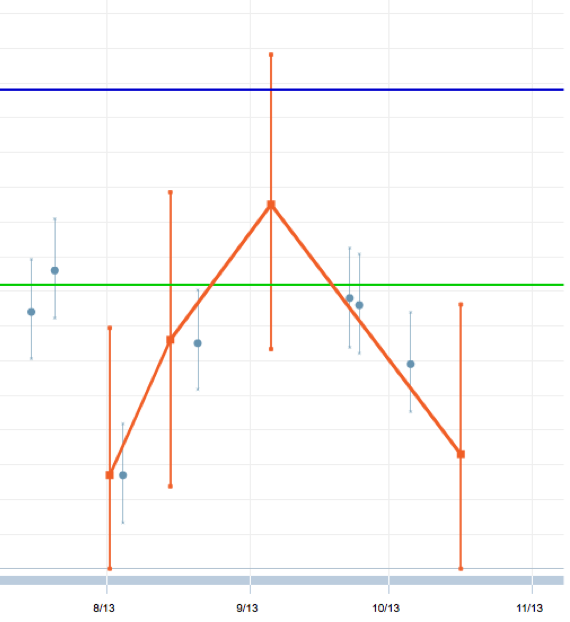
Horse B
The graphs allow us to understand what is happening much faster. We can see that Horse A had one poor race in comparison to its other races, which came after its best. And while the remaining races have seen some fluctuation they’re all at a similar level.
Horse B has shown a steady rise and then dropped down again.
Now I’m not saying that you can’t see this from the figures. Of course you can. And I’m not saying that there aren’t people who can’t see this faster from the figures. Of course there are.
What I am saying, is that the majority of bettors who have not learnt to interpret numbers as second nature will find it much easier and quicker to understand the visual representation shown in the graphs rather than looking at the figures.
The question is, how can we use the visualisation of data to help us assess a horse race?
I’m going to propose one particular method that I’ve found to work very effectively for me. This is a method that’s going to use speed figures and is therefore best suited to all-weather sprints. However it can also be used effectively on other race conditions as well once you have some experience with it.
For the purposes of this article I’m going to assume that you either create your own, or have access to, speed ratings. The creation of these ratings is something that is best saved for another article.
I have also created an Excel spreadsheet that you can use with this strategy and this is provided in the members area.
An Overview
Before we jump in I think it’s important to give an overall view of what we’re going to be doing and why.
We’re going to be creating graphs for each horse in a race. These graphs are going to allow us to visualise a race in a way that would not otherwise be easily possible.
The graphs will contain speed ratings and the confidence intervals for these speed ratings.
Once created the graphs can be used to find selections that would not otherwise necessarily be obviously able to contend. My personal preference is to remove the horses that have no chance of winning the race before looking for the runners that have shown they should have the ability to contend.
There are some simple rules that we can apply which will allow us to determine whether the race is one that we would want to be betting on or not.
Introducing You To The Strategy
Those of you who have traded the financial markets before will be familiar with candle graphs, and we’re going to be using a simplified version of them.
The spreadsheet in the members area will do these calculations for you.
The first thing we need to do is to choose a race to analyse. This method will work on any type of race, but it is particularly suited to sprints over the all weather or the flat, and since we are no longer in the flat season I would suggest using all weather. At least until you are more experienced with the method.
Again, while you can use this strategy on fields of all sizes, the larger the field the more experience you need and I would suggest you limit the number of runners in the race to 12 to start.
For these reasons we shall be focusing on using this strategy on 5 furlong and 6 furlong races over the flat with 12 or less runners in.
Finally, we want horses with as much history as possible. For this reason avoid any races where the majority of runners have not run many races, such as Maiden races.
Step 1 – Getting The Data
In order to create the graphs we need to get the data to enter into the spreadsheet.
Start by opening the Visualising Ratings.xlsx from the members area.
When you open this file you will be displayed with the screen…
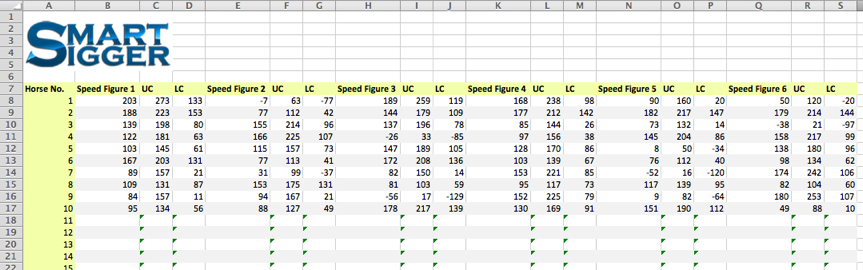
These are the figures for the 5:10 at Wolverhampton on the 29th October 2013, which is a 5 furlong race with ten runners on the all weather track.
We are interested in the last six speed ratings that each horse has achieved over the last year. We can go further back than this but I wouldn’t suggest doing so without using a time decay function on the ratings.
In our spreadsheet, under Horse 1, we enter the last six figures for Media Jury as follows…
- In the column Speed Figure 1 you enter the most recent speed figure for the runner.
- In Speed Figure 2 you enter the second most recent speed figure for the runner.
- Repeat this for as many speed figures you have for each horse, up to six.
Next to each Speed Figure column you have the UC and LC columns. These will be calculated automatically for you as you enter the speed figures.
These columns stand for Upper Confidence and Lower Confidence. They indicate what the highest and lowest the speed figure could have been with 90% confidence.
Mathematicians will tell you that this confidence level is not high enough; it should be at least 95% but preferably 99%. However, I have found that in practical application 90% works well without being too broad in range.
We shall be using these later on to help us find our selections.
Repeat this process for each horse in the race until you have entered all the horses details into the calculator.
Step 2 – Removing Non-Contenders
Now that we have all the data we need entered into the calculator, you need to change to the Graphs tab. This is located at the bottom of the spreadsheet.
Once you’ve selected this you’ll be presented with a graph for each horse in the race. These graphs display the information from the speed figures that we just entered.
Please note that they are read from left to right with the most recent race on the far right.
At the top of each graph is the Minimum For Race Contenders. This figure shows us what the minimum rating is that we would like for a horse to be considered a contender.
This is calculated by taking the horse with the highest speed figure and then looking at it’s lowest confidence level.
What this tells us is the lowest rating possible from the horse which has achieved the fastest rating from all runners in the race.
If a horses best figure, using the upper confidence level, isn’t higher than this number then it’s unlikely to be a threat.
The reason is that if a horse, on it’s best day, cannot achieve a speed rating with an upper confidence level of more than the fastest horses lowest confidence level, then it’s unlikely to have the speed necessary to win the race.
Of course, sometimes one slips through the net, but this does not happen often and certainly not enough for us to consider looking at a way to single them out initially.
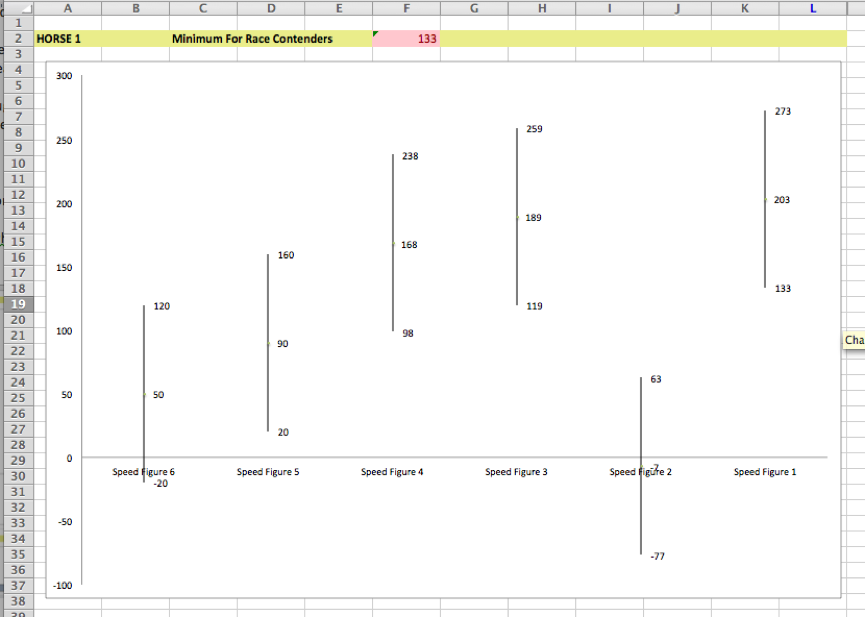
In our example race the Minimum For Race Contenders is 133, which you can see above the graph highlighted in red.
What we’re going to do is remove any horse that does not have this number or higher at the top of any of its lines on the graph.
In some races this process will not eliminate any, or very few, runners. This is one such example and it brings us on nicely to the next step.
Step 3 – Deciding If We Are Going To Bet In This Race
Our aim is not to bet in every single race. Our aim is to make a profit.
For this reason I ignore any race that has more than 3 runners that are not eliminated after completing step 2.
Again this rule can be extended when you are used to using the method and begin adapting it to your own needs.
With the lack of racing taking place due to storms while I am writing this article, I am going to continue using this race as an example in this case.
Step 4 – Choosing Which Horse To Bet On
Once we’ve got a possible race to bet on we want to determine which of the horses that could be potential contenders we may be interested in betting on.
We are only going to be betting on a runner if there is a strong argument to. You shouldn’t be looking for a reason to bet on a horse, when you do your analysis you should be looking for a reason not to bet on a horse.
I’m going to show you the two things which I consider to be amongst the most important to consider. You can add your own factors to this should you wish.
We want to:
1) Check to see if the horse has been improving. Steady improvement is best, but a jump improvement cannot be ignored.
2) Check to see what the average speed figure for the horse has been
Don’t forget, the graphs are read from left to right with the most recent race appearing on the right hand side.
The first horse gives us a very good example of an improving graph:
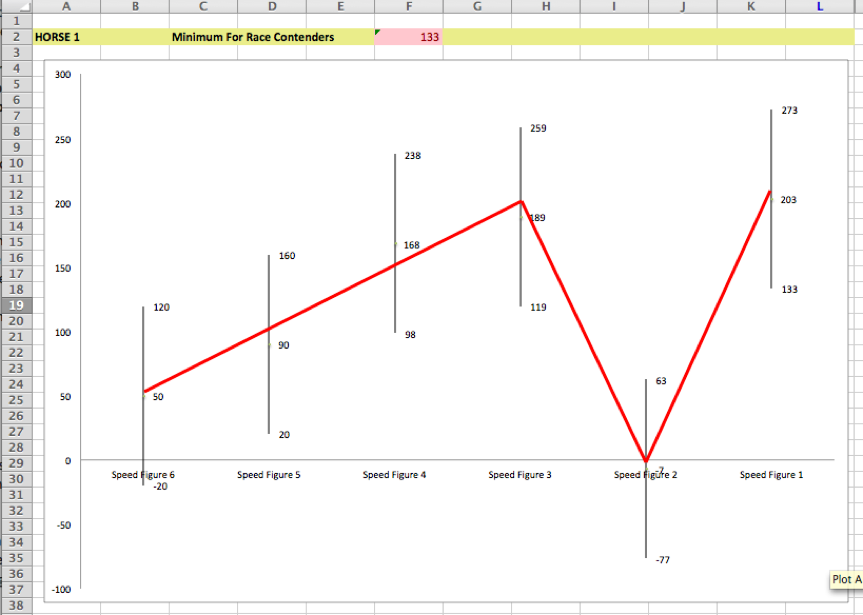
Drawing a line between this horses ratings we can see that it has been steadily improving except in the second to last race.
If we go into the horses form for that race we can see that it was running on soft ground, which based on previous performances, it doesn’t like. Although Tom Dascombe tried to make all in the last furlong when he realised the horse was not able to he laid off and coasted to the finish line.
Ignoring this race the runner has shown steady improvement and looks to have reached a peak level that it may be able to continue with in this race.
Horse 3 provides us with a good example of what to look for in terms of average speed:
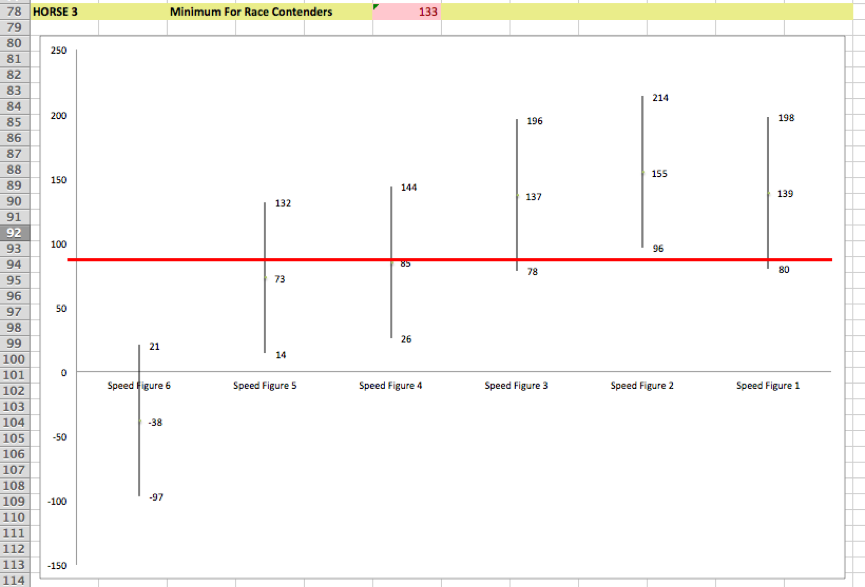
The average speed figure for this runner sits at 92 which is 41 points below the minimum that we were looking for as our minimum.
We only need to glance at the graph to see that the last three races have given the best ratings, which means that we would not want to rule this runner out. But, if the situation was reversed we may consider this horse as not such a strong threat in the race after all.
Just taking into account the two considerations that I’ve mentioned can allow this method to be used very effectively.
However, adding more factors such as ratings over similar conditions, weighting ratings for different conditions etc…
What we have done here is to implement a method of visualising speed ratings.
Once you’ve entered the data in the spreadsheet you can use the graphs to quickly visualise the information and perform your analysis.
But visualisation of data is not just limited to this, it can be much more wide reaching. We can use bubble charts to determine strength in race compared to other runners, column charts for preference to race conditions and many others.
This is just the beginning of what can be done using visualisation and horse racing data and I urge you to explore the possibilities further.
For more information, please visit: http://www.raceadvisor.co.uk/