The fourth and final major championship of 2019 heads to Royal Portrush from July 18-21 for the 148th playing of The Open Championship. In this preview, Data Golf highlight the role of the strokes gained categories in their model, and, as usual, highlight a few players where the model’s assessment diverges from that of the betting markets.
- Using strokes gained as a predictive model
- 2019 British Open: Top 15 prediction
- Where might bettors find value?
- Read: How to bet on golf
However, while this model may provide reasonable “baseline” estimates, it can certainly be improved upon along several dimensions.
In past previews, we’ve highlighted the adjustments that can be made based on each golfer’s historical performance at the host course, or based on the number of years of experience each golfer has playing the course.
Here, we consider another dimension: how a golfer gains (or loses) their strokes.
Strokes gained explained
Since 2004, the Shotlink system has recorded the exact geographical location of each shot hit at (most) PGA Tour events.
This has allowed for the development of the strokes gained concept by Columbia professor Mark Broadie, which quantifies the quality of each shot relative to what would be expected by an average PGA Tour professional.
At the round level, this allows for a golfer’s total strokes gained (i.e. the difference between their score and the field average), to be broken into four shot type categories: off-the-tee (OTT), approach (APP), around-the-green (ARG), and putting (PUTT).
Just like total strokes gained, each of these should (and can be) adjusted for the strength of the field.
Why would breaking scores down into these categories be helpful for predicting golf performance? It turns out that some of the strokes gained categories are more predictive of future performance than others.
A closer look at Rory McIlroy and Jason Day
Shown below are the 50-round moving-averages of Rory McIlroy’s strokes gained off-the-tee, and Jason Day’s strokes-gained putting, respectively:
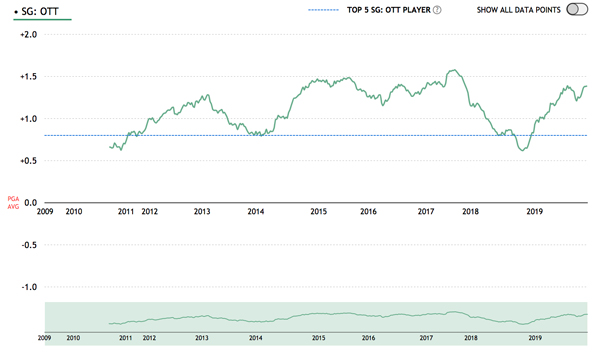
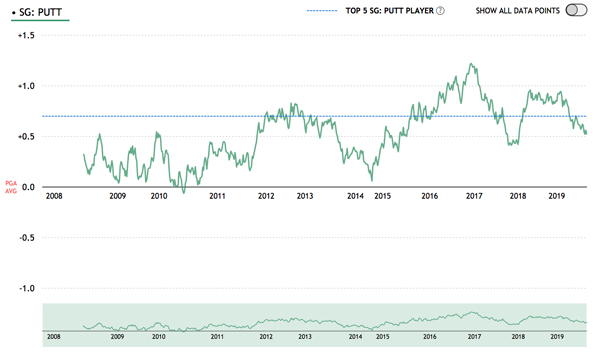
It is clear from these plots that off-the-tee performance has much less variance than putting performance (which is partly due to the simple fact that more putts are hit per round than are drives).
It turns out, as the plots seem to indicate, that past off-the-tee performance is more predictive of future off-the-tee performance than past putting performance is of future putting performance.
The predictive hierarchy of the strokes-gained categories appears to go OTT > APP > ARG > PUTT.
Golfers who are gaining their strokes with the long game, as opposed to the short game, will be expected to show less regression to the mean in their performances going forward.
The differences in predictability across the strokes-gained categories allows for improvements to be made over a pure total strokes-gained model.
2019 British Open: Top 15 prediction
Shown below are the model’s top 15 predictions with and without the strokes-gained categories incorporated for the Open Championship:
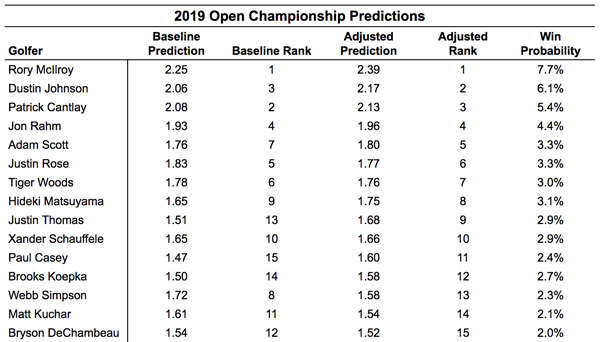
The adjustment for a golfer’s performance in each strokes-gained category makes a substantial difference in some cases.
Among the top 15 ranked golfers, the largest positive adjustment belongs to Rory McIlroy (+0.14), while the largest negative adjustment belongs to Webb Simpson (-0.14).
It is probably unreasonable to continue without commenting on the win probability assigned to the winner of four of the last 10 majors, Brooks Koepka. Koepka is ranked as the 12th best player in the Open Championship field according to the adjusted model, mainly due to his poor performances in non-major championships.
From the model’s perspective, his incredible record in the majors over the last three years can be simply attributed to randomness – his great performances have come in the right tournaments, and at the right times.
2019 British Open: Where might bettors find value?
Webb Simpson is currently trading at 114 in certain outright markets, which implies a win probability of 0.87%, compared to the model’s win probability of 2.3%.
This is even more interesting given that Simpson received a downgrade in his predicted skill level due to the fact that his recent form has been driven to a large degree by improved putting.
Using the pure total strokes-gained model, Simpson’s win probability is estimated at 3.0% – 7th best in the field.
Continuing to focus on the top tier of golfers in The Open, the model views Patrick Cantlay, Adam Scott, and Hideki Matsuyama much more favourably than the betting markets do.
All three of these golfers likely fall under the label of “consistent performers who rarely win”.
However, if you view winning as largely the product of luck rather than skill (once you have controlled for a golfer’s overall skill level), the fact that a golfer has rarely won in the past should not carry much weight.
A closer look at the underdogs
Moving a bit further down the depth chart, Kevin Streelman, who gained entry into The Open after John Daly withdrew, has been performing at a level well above his current odds.
Plotted below is Streelman’s 50-round moving average of total strokes gained, and strokes gained approach, since 2015:
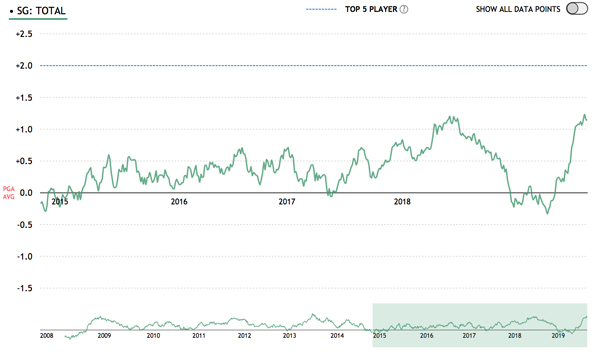
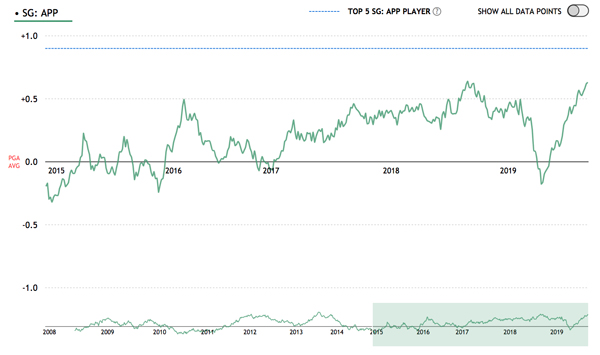
Streelman’s fall and subsequent rise in form since mid-2018 has been largely driven by his approach game.
Therefore, the model is placing more stock in the recent upward trend in performance, which is reflected in the difference in Streelman’s predicted skill level with the strokes gained categories incorporated (+0.99) and without (+0.85).
Streelman’s current outright odds range from 200 to 300 across bookmakers, while the model puts his fair odds at 135 or 111, using the baseline and adjusted models, respectively.
Jordan Spieth is not viewed in a favourable light in any version of our model, however this is especially true in the category-adjusted model.
Spieth has the largest negative adjustment in the field at -0.22 strokes per round; his recent gains in performance have been driven entirely by improved putting and around-the-green play.
Remarkably, Spieth is again being priced at a similar level to Patrick Cantlay (this also occurred at the U.S. Open). According to our model, Spieth provides one of the worst values in the field.
Conclusion
This wraps up our preview of the 2019 Open Championship. While a golfer’s overall form can be largely gleaned from their adjusted strokes-gained performance, digging a bit deeper into how those strokes were accumulated can make a difference.
Recent upticks in performance driven by putting should be discounted, while those fueled by improved off-the-tee play warrant closer attention.
About the author