- How will the course affect the result?
- The important statistics to consider in PGA Championship betting
- Where might bettors find value?
- Top 10 predictions
Thanks to the new golfing calendar, the PGA Championship heads to Bethpage Black Course in Long Island, New York from May 16 to May 19 – now making it the second major of the year. Read on for some in-depth analysis and 2019 PGA Championship predictions.
With Tiger’s historic victory at The Masters only just entering the rear-view mirror, golf’s second major of 2019, the PGA Championship, is already upon us. Despite losing its label as “Glory’s Last Shot”, the PGA’s move to May seems good for the game, with each month from April to July now offering major championship golf.
In this preview, we first discuss the predictive content of one aspect of “course fit”; namely, the notion that certain golfers tend to perform better on difficult courses. This specific example is used to demonstrate some general principles when predicting golf. We then provide some specific 2019 PGA Championship predictions from our model and contrast them with market sentiment.
How difficult is Bethpage Black?
Bethpage Black, site of the 2019 PGA Championship, is a difficult golf course, as the sign proudly displayed near their first tee indicates. In the two U.S. Opens it has hosted (in 2002 and 2009), Bethpage played as the most difficult course on the PGA Tour in relation to par. In the two regular PGA Tour events hosted at Bethpage (the 2012 and 2016 Barclays), it played as the 16th and 12th hardest course in the 2012 and 2016 PGA Tour seasons, respectively. This easier scoring was in part an artificial difference, as the par was changed from 70 to 71 for The Barclays.
- Read: How to bet on golf
This week Bethpage Black will play as a par 70, and tough scoring conditions should be expected if past tournaments hosted here are any indication. Therefore, it seems that a reasonable exercise could be to identify the golfers who have performed well on difficult golf courses in the past, and try to incorporate that into our “baseline” predictions this week.
Recall the definition of our baseline predictions: these are our estimates of golfers’ current skill in units of strokes gained per round. They are derived from a player’s performance at all tournaments and do not include any course-player interactions (e.g. adjustments for course fit). To identify whether a golfer has performed well at difficult golf courses, it is their performance relative to their baseline at the time that matters, not their absolute performance.
Which players perform best on difficult courses?
We define a difficult course as one that was among the hardest 20% of tournament-rounds in a given season (using strokes relative-to-par, adjusted for field strength, as the metric for difficulty). Listed below are the top 10 performers on difficult golf courses from 2000-present, with a minimum of 100 rounds played on difficult courses required to make the list.
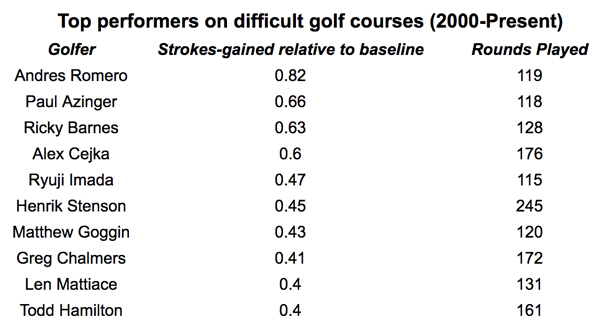
At first glance this list seems reasonable. However, golf performance is very random; consequently, there will be variation in a golfer’s strokes gained relative to baseline no matter what dimension the data is cut along. The question is then whether the variation we observe is greater than what we would expect simply due to the inherent variability of golf performance.
To arrive at a rough answer, the statistical details are straightforward. The standard deviation in the unexplained part of strokes gained is about 2.75 strokes per round. (Equivalently, the standard deviation in strokes gained for an individual golfer over time is about 2.75 strokes per round).
If we assume golf scores are normally distributed, we should expect roughly 68% of a golfer’s rounds to be within +/- 2.75 strokes of their baseline, and 95% to be within +/- 5.5 strokes. Further, if we take an average of N scores, we know that the distribution of this average will itself have a standard deviation of 2.75 /√N.
The randomness of golf scores is often underestimated; surprisingly large sample sizes are required to confidently detect differences of 1 stroke or less between players
In simpler terms, suppose we randomly selected 100 scores from a golfer who is truly a +2 SG per round golfer, and we calculated the average of those 100 scores. Repeat this process many times (i.e. selecting a random set of 100 scores each time), and you will find that 68% of your strokes gained sample averages will be between 1.73 and 2.27, and that 95% will be between 1.45 and 2.55.
Even when analyzing a seemingly large sample size of 100 rounds, the estimate of a golfer’s true ability will be off by at least 0.275 strokes 32% of the time. This should give anyone pause before making confident predictions about golf performance. The table below lists the relevant numbers from this same exercise for different values of N.
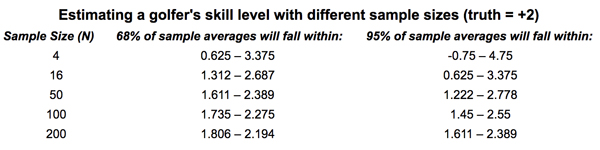
This table is fairly jarring, even for those well-acquainted with the randomness of golf data. Drawing conclusions from 16-round samples, for example, is a near-hopeless endeavour: 32% of the time your estimate of a golfer’s true skill will be off by more than 0.7 strokes!
Returning to the list of top performers at difficult courses, we should now be skeptical that these numbers are meaningful. In our dataset, there were 224 players who had played at least 100 rounds at difficult golf courses.
Due to randomness alone (i.e. no true performance differences at difficult courses), we should expect roughly 4-6 players to have a strokes gained relative to baseline of at least 0.5 per round, using the analysis described above. In fact, we observe 4 players above 0.5. A similar finding holds among the worst performers on difficult courses.
Predicting performance at difficult courses
At this point, it’s quite likely that we are analyzing statistical noise. To eliminate the doubt that remains, we next consider all golfers who played at least 200 rounds at difficult courses, and plot their performance relative to baseline in their first set of 100 rounds against their performance to baseline in their second set of 100 rounds.
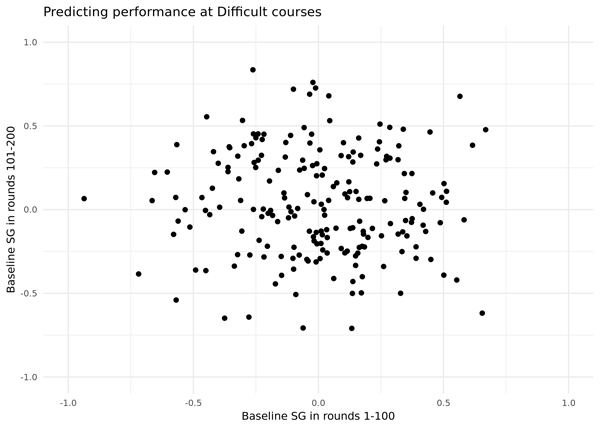
The plot indicates that a golfer’s performance at difficult courses in rounds 1-100 provides no information about how they performed at difficult courses in rounds 101-200. Our list of top performers at difficult courses was entirely driven by statistical noise.
It could easily be argued that lumping all “difficult” golf courses together is not the correct way to go about this analysis; different courses are difficult for different reasons. Skills that could lead a golfer to excel on one set of difficult courses may not be transferable to another. It’s possible a more refined analysis could find something with predictive value.
However, the more general point being made here is that the randomness of golf scores is often underestimated; surprisingly large sample sizes are required to confidently detect differences of 1 stroke or less between players, or between the same player under different conditions.
Large differences in player performance will be discovered along any dimension you wish to slice your dataset. To understand if these differences are meaningful, a predictive exercise such as the one performed above is necessary.
Top 10 predictions
Returning to this week’s PGA Championship, we see little reason to deviate far from our baseline estimates of golfer skill. From a course history perspective, golfers in this field will have played at most 16 competitive rounds at Bethpage Black – most will have played much fewer – which is not large enough to draw any strong conclusions.
From past work on course history, we know that it does provide some predictive value, but this week the largest adjustment to a golfer’s baseline skill we would recommend is roughly 0.1 strokes per round.
The table below displays our top 10 predictions in terms of win probability alongside each golfer’s baseline skill estimate (in units of strokes gained relative to the PGA Tour average).
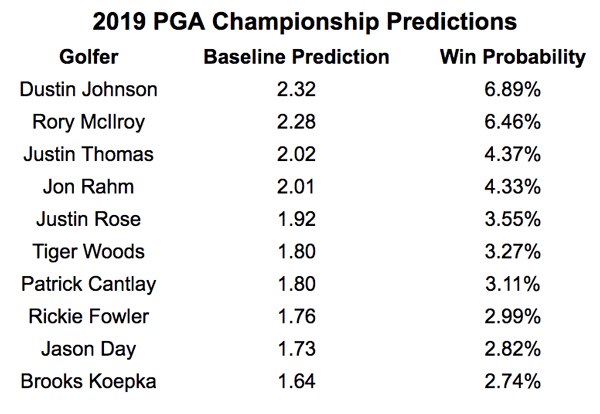
Relative to the betting markets, among this top tier of players our model is highest on Patrick Cantlay and Jon Rahm. Cantlay is no surprise: he is chronically undervalued by the market according to our model, and was also highlighted in our Masters preview. Jon Rahm might be the most underrated golfer in the world; the start to his professional career has been better than any recent player not named Tiger Woods.
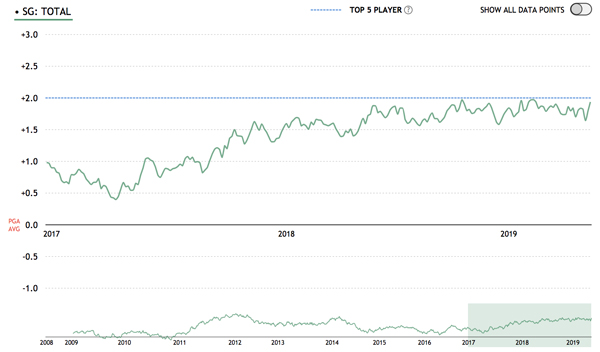
Readers may be surprised how far down the list Brooks Koepka’s name sits given his recent track record in major championships. However, Koepka’s play across all tournaments has not consistently been at the level of a top 5 player in the world. While his performance in recent majors has been nothing short of remarkable, this does not necessarily mean Koepka will continue to outperform his baseline in majors – recall the analysis above.
Sitting just outside our top 10 ranked golfers is Webb Simpson, a player our model looks upon more fondly than the market. The quality of Simpson’s recent play seems to have gone largely unnoticed; since early 2018 he has slowly been approaching the level of play of a top 5 player in the world.
Where might bettors find value?
Moving further down the depth charts, some of the model’s usual suspects appear as positive values relative to the market: Keegan Bradley, Lucas Glover, and Aaron Wise. That Glover remains a positive value is a surprise given his win in the 2009 U.S. Open hosted at Bethpage. This fact typically would be valued much more by the market than our model.
A final note of interest is the degree to which the market values golfers who have won tournaments in the past. For example, over the last three seasons the performances of Louis Oosthuizen and Rafa Cabrera Bellohave very closely tracked each other; despite this, Oosthuizen is currently priced at European odds of 86 on the Betfair Exchange, while Cabrera Bello is priced at 323.
If you view winning a golf tournament as in large part the product of good circumstance, then this discrepancy is unwarranted. However, if you view winning as a skill, one which is not necessarily reflected in simple strokes gained averages, then perhaps the market has judged these odds correctly.
We adopt the former view: two golfers who have performed similarly overall, but one has managed to accumulate a few more wins than the other, is most likely just the result of good fortune.
Brooks Koepka, Henrik Stenson, and Francesco Molinari all appear to be viewed much more favourably by the market than their baseline abilities would indicate. This could be driven by the fact that they are all “proven” major champions.
Conclusion
Narratives in golf are typically formed by “overfitting” small samples of historical data (i.e. sifting through historical data looking for interesting patterns). There is usually no reason to believe that they provide information about golfers’ future performance.
The 2019 PGA Championship, where course history and course fit are largely unknowns, will be an excellent opportunity to trust the long-term data and take a stance against the narratives being pushed.
About the author