- Level vs. percentage staking
- Distribution of yields for level versus percentage staking
- The asymmetry of percentage losses and gains
Pinnacle’s Betting Resources has previously compared and contrasted a number of different staking strategies. I’ve looked at the expected profitability and risks of ruin for these strategies. For my latest article I want to compare specifically the two most commonly used plans: level versus percentage staking.
Level staking
With a level staking strategy all stakes are the same size, regardless of what your betting odds are. Some bettors find level staking too inflexible in as much as it takes no account of the probability of winning your bet – or rather the risk of you losing one.
Why, for instance, would you want to risk the same amount of capital on something that has half, or quarter, or an eighth the chance of something else happening? Doesn’t it make more sense to scale stakes so that they are proportional to the risk associated with the bet?
In the short term, such an argument has its merits; over the longer term, perhaps less so. Betting at longer odds means you are more at the mercy of statistical variance, or luck, both good and bad. More good luck can mean more profit. Unfortunately, the corollary is that more bad luck implies more loss.
However, the longer your betting history is, the smaller that variance becomes. Good and bad luck even out. Readers of my article last month may remember the simple formula I used to estimate the spread (or standard deviation,σ) of possible returns (%) betting n level stakes at ‘fair’ odds of o.
σ=√(o-1)/√n
Having four times the number of bets will half the statistical spread of possibilities. Betting longer odds increases the spread of possibilities, but it will still decrease with increasing number of bets. 400 bets at odds of 5, for example, will have the same spread of possibilities as 100 bets at odds of 2.
Betting the same stake for longer odds does imply a greater risk of capital loss on a bet by bet basis. But over the longer term you are not giving up potential profits by reducing those stakes (provided, of course, you are a bettor holding positive expected value).
Staking to win the same profit regardless of the odds means less profit will be contributed by the winning longer odds, simple by virtue of the fact they win less often. One might then wonder whether it is even worth bothering to bet longer odds at all.
Percentage staking
Percentage or proportional staking calculates stakes as a proportion of your current bankroll; hence they will increase as your bankroll grows after winning, decrease as it shrinks after losing. Advocates of one specific percentage staking plan, the Kelly criterion, argue that it is the most efficient way to grow a bankroll, although it can only achieve this by requiring a rather aggressive attitude towards risk management.
More generally its appeal lies in allowing a winning bettor to grow their bankroll faster than they could by simply betting level stakes. It’s also worth reminding ourselves that, in theory at least, we can’t ever go bust betting percentage stakes, as even if you lost every single bet, you are never committing the whole of your remaining bankroll, only a proportion of it.
Nevertheless, it is the interplay of losing and winning in sequence that throws up some rather interesting observations when comparing the performance of this money management strategy with level staking, as we shall see.
Distribution of profits for level versus percentage staking
Consider a betting history of 1,000 bets at odds of 2.00 where the bettor holds a 5% expected value (EV) that is the expectation of returning $105 for every $100 wagered. The histogram below shows the spread of profits for level stakes (5 units) and percentage stakes (5%) alike from a 10,000-run Monte Carlo simulation.
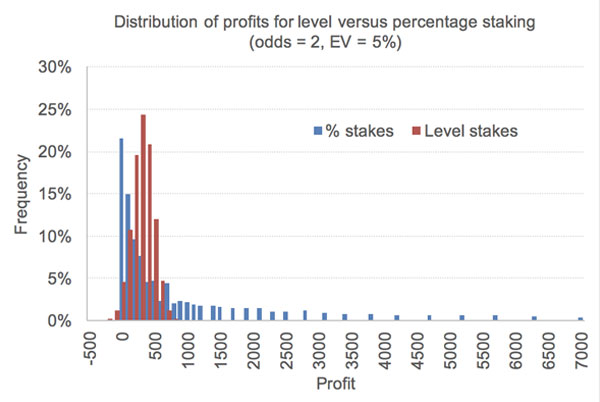
For level staking the spread of possible profits follows the typical bell-shaped normal distribution curve as we would expect. The average (and median) profit is 250 units, which is what we would expect after turning over 5,000 units holding a 5% advantage.
For percentage staking the shape of the distribution is markedly different, and heavily skewed towards the higher profitability end. Again, it’s probably not that surprising, since a lucky performance could see bankrolls and stakes grow exponentially.
I’ve stopped the chart at a profit of 7,000 units simply for clarity, but the largest profit made in the 10,000 runs was nearly 95,000 units. This skew has a significant influence on the average profit. Whilst the median is still 250 (implying about half are less and half are more profitable), the average is 1,120, weighted by a few very large profits that the Monte Carlo simulation delivered.
Look closely at the left-hand side of the histograms. You will see that there are more underachieving outcomes for percentage staking than for level staking. About 21% of them in this simulation were actually unprofitable, compared to only about 5% for level staking.
Distribution of yields for level versus percentage staking
Instead of comparing profits, let’s now compare yield percentage for the two staking plans. Clearly for a very profitable percentage staking history, the total turnover of stakes will be much greater.
One percentage staking profit, for example, saw a profit of 2,462 units (compared to 440 from level staking), but to achieve that 33,699 units were turned over (compared to 5,000 units for level staking). In fact, in this example the profit over turnover or yield was lower for percentage staking (6.85%) than it was for level staking (8.80%). Is that typical? The next chart shows how all yields were distributed for the full Monte Carlo simulation.
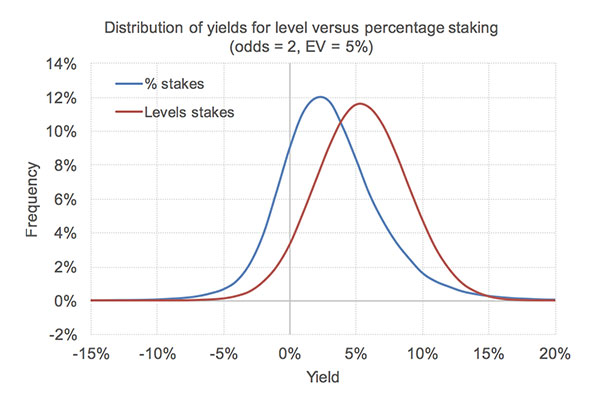
The average yield from level staking was 5.00%. Compare this to the average for percentage staking which was just half this at 2.51%. The chart also further illustrates how many more possible outcomes are unprofitable when betting percentage stakes compared to betting level stakes.
We can change the simulation parameters, for example different betting odds and different expected values (EV) held by the bettor.
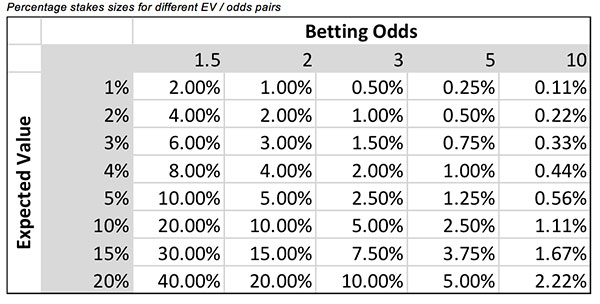
For this article I chose 40 different EV / Odds pairs. To limit further the number of possible parameter combinations I only considered the percentage stake size equivalent to that dictated by full Kelly staking strategy, calculated by EV / Odds -1, where EV is expressed as a percentage.
For example, for the scenario already discussed (EV = 5%, Odds = 2.00), the Kelly percentage is 5% / (2.00 – 1). The percentage stakes are shown below for all 40 combinations. For the level stake scenarios, the magnitude of the percentage was used. Thus, for the EV = 3%, odds = 3.00 combination which implies 1.5% stakes sizes, level stakes of 1.5 units were used.
Percentage stakes sizes for different EV / odds pairs
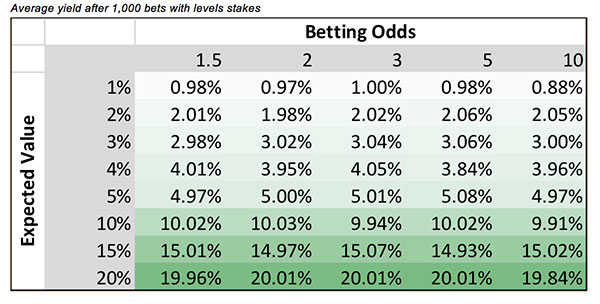
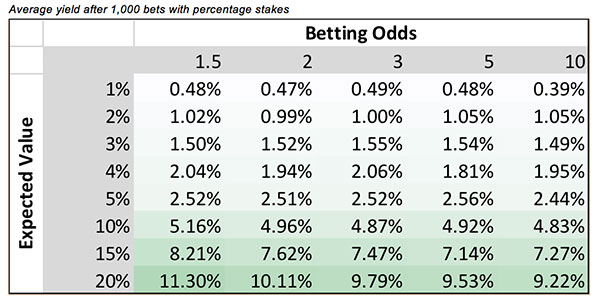
The next two tables compare the average yields achieved from the Monte Carlo simulations. For level stakes, the yields are in line with expectation, plus or minus a little bit of random noise which to reduce further would have strained my limited computational resources.
In contrast, the yields from percentage staking are generally about half those values. This was truly an unexpected and perhaps unintuitive finding, although the discussion which follows will reveal why it happens.
Average yield after 1,000 bets with levels stakes
Average yield after 1,000 bets with percentage stakes
Probability of unprofitability
Even sharp bettors holding profitable expected value face a non-zero probability of failing to make a profit over a specified betting history. Of course, the law of large numbers means that probability diminishes as their betting history gets longer. Nevertheless, it’s worth considering those probabilities for these simulated 1,000-bet histories for the purposes of comparting level and percentage staking.
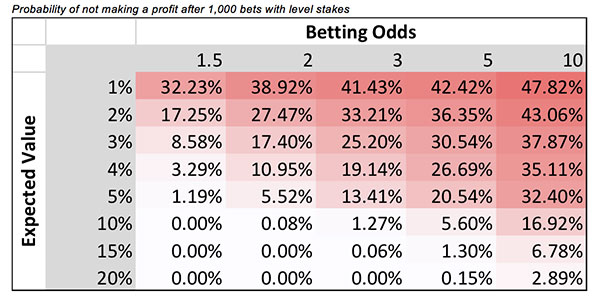
The last two tables show the probability of each EV / Odds combination failing to return a profit based on the 10,000 simulation runs.
Again, as for average yield there will be a little bit of residual random noise, but the broader pattern is clear: you’re always more likely to fail to show a profit betting percentage stakes compared to betting level stakes, no matter what odds you bet or what EV you hold, and sometimes the magnitude of the difference is considerable.
Probability of not making a profit after 1,000 bets with level stakes
Probability of not making a profit after 1,000 bets with percentage stakes
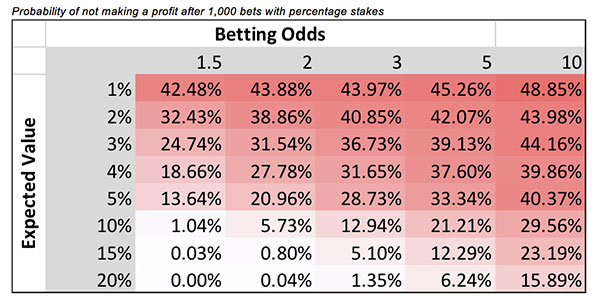
By way of example, a reasonably sharp handicapper (odds around 2.00) holding a 3% advantage over the bookmaker could expect to be showing losses after 1,000 3-unit bets about 1 in every 6 times. If, instead, they chose to bet 3% stakes, that would rise to nearly 1 in 3.
An explanation: the asymmetry of percentage losses and gains
Why does percentage staking appear to be inferior to level staking, at least in terms of expected yields and the ability to show a profit? The simple explanation is that it takes a bigger percentage growth to recover a previous loss.
Let’s consider the example of even-money betting. Losing a 5% stake drops a 100-unit bankroll to 95 units. To recover that takes a profit of 5/95 or 5.26%, but the percentage staking strategy would only advocate a next bet of 4.75 units and winning it at odds of 2.00 would return the bankroll 99.75. By contrast, the bankroll from level staking would be back at 100 units.
The problem is the same in reverse. Losing an even-money bet following a previous even-money winner will lose more absolute capital than was previously won. In this example, regardless of whether you win or lose first, your bankroll is going to finish on 99.75, less than what you started with, despite theoretically holding an expected value of 0% for this pair of bets.
More generally, and regardless of the betting odds, when you lose it will take longer to recover; when you win it will take less time to regress.
Of course, in purely monetary terms a bettor holding proven profitable expected value will make more profit absolutely than their level stakes counterpart. That, after all, is the point of percentage staking.
Nevertheless, this exercise has been a useful reminder that as with anything in gambling, there is always a trade off to be had between risk and reward.
In return for a more aggressive acceleration of profits which percentage staking offers, one must accept a greater likelihood of doing considerably worse than expectation (and potentially losing money) simply because of the asymmetric nature of the distribution of possible outcomes.
About the author