Related Articles
Related Jobs
- Is correct score betting profitable?
- Modelling correct scores
- Favourite-longshot bias and correct score betting
- Making correct score predictions

Betting on correct scores is one of the most popular soccer markets for recreational bettors. In this article betting expert Joseph Buchdahl analyses correct score betting using “true” score odds. Is correct score betting profitable? Read on to find out.
Whenever I walk past a bookmaker on my high street I am always met with an enticing offer of a correct score bet to lure me into the shop. Typically, such offers will say something like “Tottenham to win 2-0 pays £100 for a £10 stake”.
Whilst the rewards look attractive, these adverts do not exist for the benefit of the customer. Rather, they hide what the bookmakers know is a large advantage for them. This article will investigate just how large that advantage really is.
Correct score betting
A popular market in football betting is predicting the final score of a game. Unlike straight match odds for which there are just three possible outcomes – home, draw or away – there are many more possible scores.
Even the most common scores have occurred less than 12% of the time throughout English football league history
Bookmakers will typically limit the number of correct score odds to a maximum number of goals per team. If we call that number n, the maximum number of possible scores quoted by the bookmaker is then given by the formula (n+1)2. For example, games that finish with anything from 0 to 6 goals for either team can have 49 possible scores.
Unsurprisingly, the odds for correct score betting are considerably longer than the match odds because each possible score has a much lower chance of happening than just a straight home, draw or away result. Even the most common scores – 1-1, 1-0 and 2-1 – have all occurred less than 12% of the time throughout English football league history.
Traditional bookmakers love longshots. Firstly, they make good bait to attract customers. Secondly, they make for great stories when bettors win which is useful for the purposes of attracting even more customers. Thirdly because of the number of possible outcomes and the level of uncertainly the bookmakers apply a larger margin than for match odds.
Pinnacle’s correct score margin for the 2017/18 League Cup semi-final between Arsenal and Chelsea, for example, was 5.3%, compared to 2.5% for the home-draw-away, and that only considered scores for n up to 3. Other bookmakers use much larger margins, in some cases as high as 60% where n = 6 or higher.
Finally, and most importantly of all however, bookmakers shorten the longer prices much more than the shorter ones without bettors really noticing or caring.
The Favourite–Longshot Bias
In June 2016 I wrote about something called the favourite–longshot bias. This is the tendency for bettors to overvalue (and over-bet) longshots and undervalue (and under-bet) favourites. Because we are rather poor at assessing true probabilities, particularly for events that have either a very low or very high probability of outcome, we will readily wager too much money on things that have little chance of happening and not enough on things that are very likely to happen.
At the same time, bookmakers must protect themselves against the possibility of large payouts, particularly when prediction errors for lower probability outcomes can have a much greater impact (as we will see later in the article). As a consequence, they will shorten prices for longshots considerably more than for favourites when applying their margin.
Modelling correct scores
In April 2017, Pinnacle author Benjamin Cronin showed us how to use the Poisson distribution to predict the correct score of a football match.
Whilst not a perfect model for predicting correct scores (it considers home and away goals as independent whilst in reality they will not be) it does a pretty reasonable job of simulating score probabilities which closely correlate with actual result frequencies. Specifically, Ben looked at the game played between Tottenham and Everton during the 2016/17 Premiership campaign.
By looking at games the two clubs had played the season before, Ben’s model predicted Tottenham would score 1.623 goals. Obviously, this is an absurdity; teams don’t actually score fractions of goals. Statistically, however, this is telling us is that Tottenham could be expected to score an average of 1.623 goals if playing many games at home against a team as strong (or weak) as Everton.
From this expected average, the Poisson distribution then allows us to calculate the probabilities of Tottenham scoring 0, 1, 2, 3 or more goals. Similarly, Ben calculated Everton’s expected goals to be 0.824. The calculated score probabilities are shown in the table below.
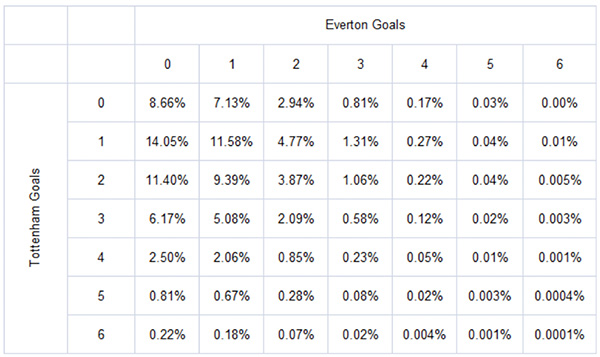
We can convert these probabilities into ‘true’ decimal betting odds simply by inverting. For example, an outcome probability of 25% (or 0.25) would have fair odds of 4.00. The corresponding ‘true’ odds for the 49 possible correct score outcomes are shown below.
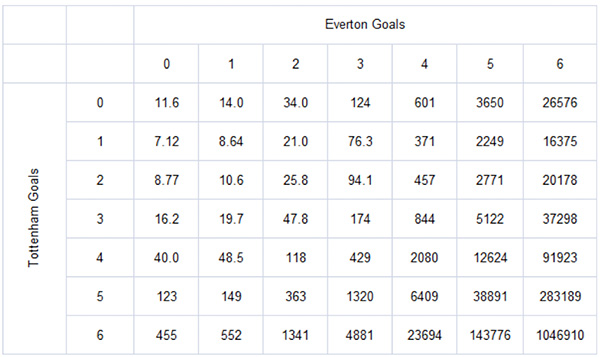
Comparing modelled and actual betting odds
How do these ‘true’ correct score odds compare to actual published odds for that game? The average market prices as recorded by the odds comparison Oddsportal.com are shown below.
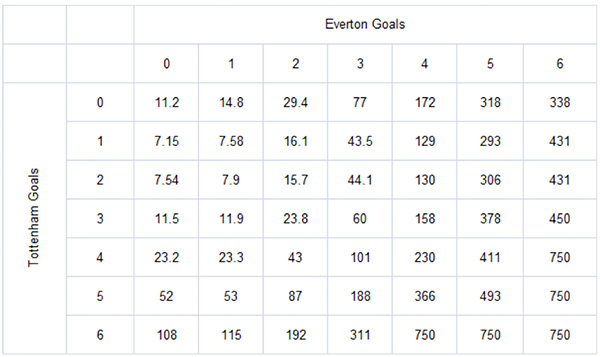
The theoretical margin for this book is 40%. A casual comparison of this table with the ‘true’ odds above reveals that as the score becomes less likely, the actual odds start to deviate significantly from the ‘true’ ones. Clearly, just as for match odds, the bookmaker does not apply his margin equally across all outcomes. The less probable the outcome, the larger the specific margin weight for that score.
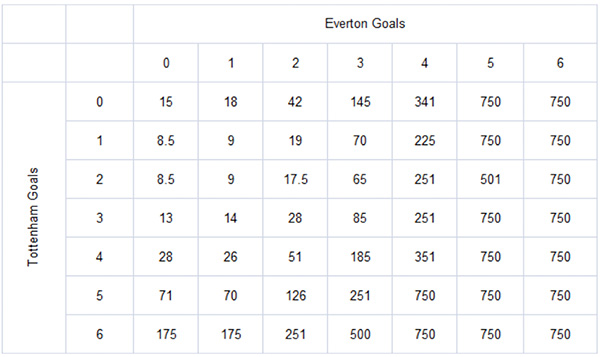
Best market odds are shown next. The theoretical margin for the best prices that were available is still 14%.
The Favourite–Longshot Bias and correct score betting
The simplest way to estimate the strength of the specific margin weight applied by the bookmaker for each score is to divide the actual odds by the modelled ‘true’ odds.
For example, the 0-0 score had an average betting price of 11.23. Dividing this by the modelled price for the same score – 11.55 – gives a figure of 97.2%. This is equivalent to the expected return on investment (ROI) a bettor could expect to make. For every $100 wagered, he would expect to return $97.20 or lose $2.80, if repeating this sort of bet many times over.
Applying this simple calculation for all scores, I have tabulated the results in the form of a heat map below. The darker the red, the worse the expected return on investment, implying a larger specific margin weight applied to that score by the bookmaker. Where expected ROI is greater than 100%, this is shown in green.
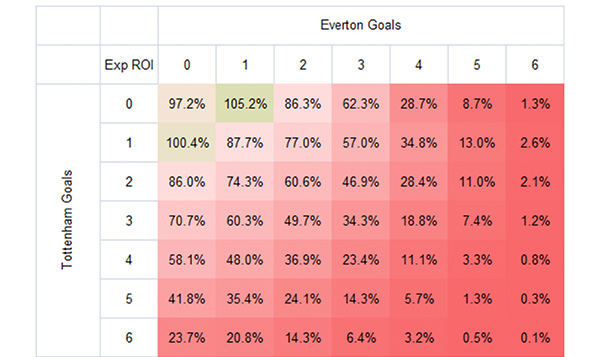
With the exception of a couple of scores, all outcomes unsurprisingly face negative expectation. The bookmaker, after all, is not a charity. But the expected ROIs for high scores are truly miserable. The 3-3 draw, for example, has an expected loss of two-thirds. Anyone foolish enough to consider betting 5-5 draws on a regular basis could typically expect to lose nearly 99% of their stakes.
Whilst there are a few more expected profitable scores betting the best market prices (see below), the broader picture remains the same: high scores have terrible odds.
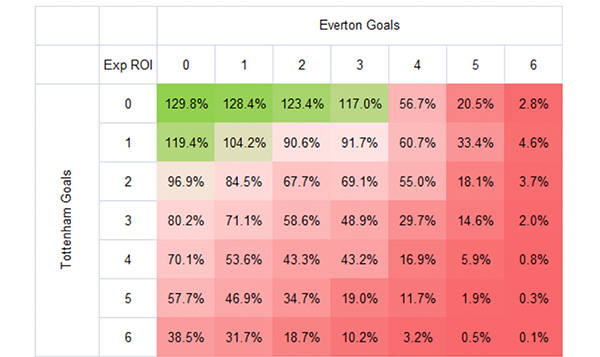
Furthermore, don’t assume that the odds for a low-scoring Everton win were necessarily holding positive expected value. The outputs in these heat maps are naturally dependent on the accuracy of the underlying Poisson goal prediction model from which ‘true’ odds are calculated. As mentioned before, the Poisson model does have its limitations and a fair few detractors. Perhaps more importantly, we can’t be certain Ben’s figures for Tottenham’s and Everton’s expected goals were ‘true’. (If we knew exactly what they were, then betting would be easy) The values used for the expected goals are potentially a significant source of error.
- Read: What is expected goals?
For example, using values of 1.93 and 0.88 goals for Tottenham and Everton respectively (values much closer to those implied by the spread betting markets for that match) would have ensured that no single correct score odds offered positive expected value, even at best market prices.
The influence of errors for low-probability scores
Suppose now we thought that Tottenham’s expected goals was much higher. In their previous 10 home games they’d scored 27 goals, winning 9 of them. Similarly, Everton had been scoring reasonably well away, with 10 in their previous 10 games, even though they had only won twice. Using figures of 2.7 and 1.0 for expected home and away goals we might very well have been tempted into betting on a 3-2 home win and collected a decent return at odds of 27/1 when the game finished with such a score.
With these model inputs, the expected ROI for this result was 113.5% compared to 71.1% shown above, a proportional increase of over half. It is precisely for this reason that the margins applied by bookmakers to the less likely scores are so large. The lower the probability of outcome, the greater the impact any error in the score prediction model will have.
Since bookmakers have to use models like anyone else to predict scores, they must protect themselves against the liability of making a mistake. Consider a 6-1 score: Ben’s original model predicted it would hold an expected ROI of 31.7%, but with these new inputs it is 232.8%, over 7 times greater. For a 6-6 draw, the change is 19-fold.
Correct score predictions: Don’t be fooled by the law of small numbers
In February 2017 I wrote about the law of small numbers, where bettors misinterpret short-term profitability as representative of predictive skill. For those who like betting correct score odds it can be particularly dangerous. Consider someone who bets lots of 3-2 correct scores at 27/1 as for Tottenham v Everton. An early win can easily give the impression that they had found an error in the bookmaker’s pricing and had secured positive expected value.
Of course it’s possible that this is true, but the evidence suggests it’s far more likely they’ve just been lucky. We prefer causal explanations over chance for things that happen; bettors who make a profit are easily fooled into assuming they must have had something to do with it. Furthermore, given the fairly reasonable probability of showing a profit within the first 27 wagers priced 27/1, as the chart below illustrates, the world of correct score betting will not be short of individuals ready to insist that they have these predictive skills.
Survivorship bias will then ensure the rest of us perceive an increased likelihood of the prevalence of such skills. History is generally written by the winners. Profitable bettors tend to talk a lot more about their wins than unprofitable bettors do about their losses.
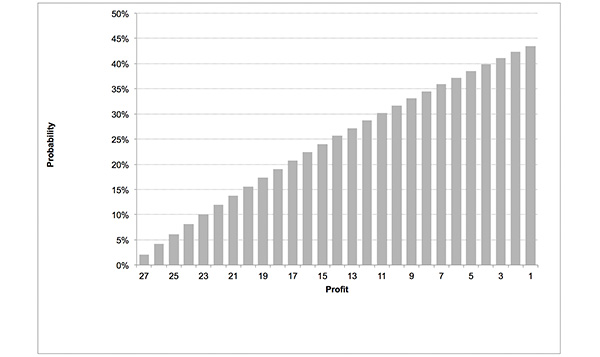
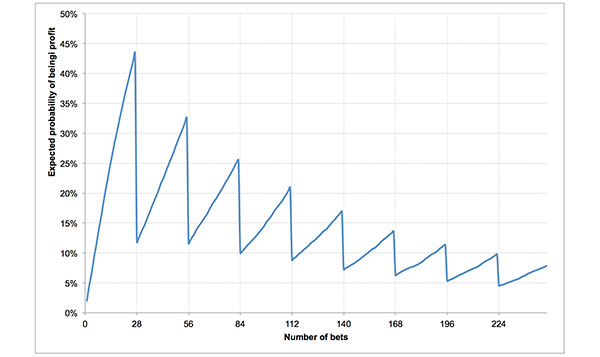
Expectations over the longer term, however, reveal the broader picture. After each set of 28 wagers, the probability of being in profit will nosedive due to the fact that one win is worth 27. Of course, this pattern of expected profitability quickly diminishing towards zero is hardly surprising given an expected ROI per wager of just 58.6% (assuming, of course, Ben’s model is correct).
Betting on correct scores: Summing up
Many bettors love the appeal of a big win offered by correct score betting,and can be easily fooled by success. However, those attracted by the much longer odds available must recognise that not only will they have a far smaller chance of winning, but also the way the bookmakers manipulate their odds ensures that they will potentially be facing a far larger expected disadvantage.
True, there is more opportunity for bookmakers to make bigger errors, but that is one of the reasons why they make the higher correct score odds so unfair.
Read more of Pinnacle’s expert betting advice

