The closing line is often used to assess the skill of a bettor or tipster. If someone bets or offers tips specifically on tennis, it is very important to understand the efficiency of the tennis betting market when assessing their skill. Read on to find out how efficient the tennis betting market is.
- Testing the efficiency of the tennis betting market
- How to test the record of a “skilled” tipster
- How do you know who is a good tipster?
A successful professional tennis tipster by the name of @nishikoripicks on Twitter has been marketing his service on the tipster supermarket Pyckio, and has an impressive (and highly statistically significant) record of profits. However, he doesn’t beat the closing price, or at least not sufficiently so to suggest that his long-term expectation will continue to be beneficial for his customers after subscription costs are taken into account.
According to the closing line value hypothesis this implies he has largely been lucky. According to @nishikoripicks, such a hypothesis may not be wholly accurate. For this article, I have attempted to find out which position is more accurate by investigating the efficiency of the tennis match betting market.
At the heart of the closing line value hypothesis is the idea that the closing line or price of an event represents the ‘true’ price or probability of an outcome occurring because it reflects the most information known about it thus far.
In previous articles I have explored how, for soccer at least, the closing price is a very accurate measure of outcome probability that can be used to predict the profit expectation of a bettor, and how beating it might be used to test your betting skill.
The counter argument insists that the closing price cannot be wholly efficient, at least not for smaller samples of matches, if tipsters such as @nishikoripicks sustain high levels of profitability over thousands of bets. Although it is easy to be fooled by the law of small numbers and make erroneous generalisations from smaller patterns of bets, we should at least consider the possibility that @nishikoripicks’ performance is evidence of real forecasting skill.
There are a number of potential explanations for why a closing market might not be completely efficient. I’ve attempted to model how one might work in practice: a market could be efficient on average but inefficient at the individual price level due to heuristic biases, for example price anchoring.
- Read: Heuristics & betting
Another explanation might be that the bookmaker intentionally biases their market to increase profitability at the expense of square (or unskilled) bettors. I’ve previoulsy explained how that might work for a point spread betting market.
Now, we can take a closer look at the tennis betting market and test it for evidence of efficiency.
Analysing the data
Miguel Figueres of WinnerOdds, the tennis forecasting specialist, has kindly provided me with a data set of opening and closing Pinnacle match betting odds for ATP, WTA, Challenger and ITF Futures tournaments covering the period May 12, 2015 to July 19, 2019. After walkovers and first set retirements have been removed (which are void by Pinnacle for betting purposes), a total of 68,361 matches and 136,722 individual betting prices were included for analysis.
I first tested the closing prices for evidence of the favourite–longshot bias, the systematic and disproportionate shortening of longer prices relative to shorter ones. Calculating an expected or implied win probability for each player (by inverting the odds), I categorised the data by 1% probability sub samples and compared each sample to the actual win percentage based on the match results.
The analysis is shown in the chart below. The yellow line represents perfect efficiency, i.e. players with a predicted 10%/50%/90% probability win 10%/50%/90% of the time. The blue dots and trend line show the actual data. For a bookmaker’s odds with a betting margin applied, the blue line should always lie below the yellow.
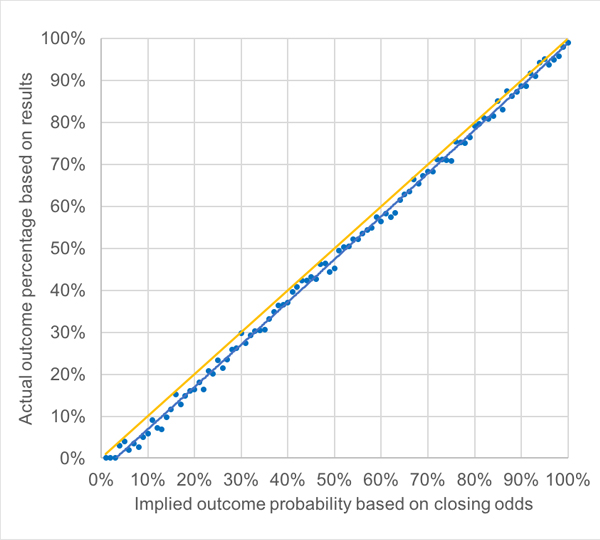
Despite a high degree of price efficiency, the divergence of the blue and yellow lines as odds trend longer is a clear sign of a favourite–longshot bias, albeit one that is fairly weak given the small margin typically applied by Pinnacle. For example, whilst implied outcome probabilities of 90% end up winning about 89% of the time, implied probabilities of 10% actually win only 6% of the time.
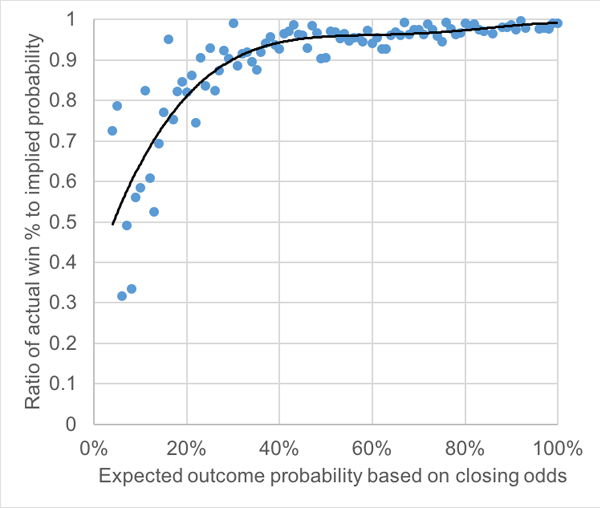
The bias is perhaps better illustrated in the next chart that compares the implied outcome probability to the ratio of the actual and implied percentages. 89% divided by 90% is 0.989 whereas 6% divided by 10% is only 0.6.
What happens when you remove the margin?
To better analyse the efficiency of the betting odds we need to remove the betting margin. The presence of the favourite–longshot bias implies that bookmakers, including Pinnacle, don’t spread their margin evenly across all outcomes. Disproportionately more is applied to longer prices.
The favourite–longshot bias is a well-established bias in numerous sports betting markets, and it is easily accounted for when removing the margin. Whist bookmakers don’t reveal precisely how they apply it, I have speculated on a number of methods which they might use.
For this analysis I have used the logarithmic function since that gives the closest match (yield = +0.47%) to an expectation of breaking even (yield = 0%) when betting every player to level stakes. By contrast, assuming the margin is applied equally across prices gives a sample yield of -2.73%, and -7.18% before it is removed.
Opening vs. Closing prices
In July 2016 I showed how the ratio of the opening price (or any pre-closing price for that matter) to the closing price was an excellent predictor of betting performance in the soccer betting markets. Suppose a price opened at 2.1 and closed at 2.0. The data implied that you would show a return of about 105% over the long term betting such prices, since 2.1 divided by 2.0 is 1.05. If your bet price to closing price ratio was 0.9, you’d expect to return about 90%. If it was 1.2, your return expectation would be about 120%.
Actual returns from hypothetically betting all soccer teams in the analysis sample correlated almost perfectly with expectation. The implication was that the closing price for those soccer matches was highly efficient (after removing the influence of the margin). Is this also true for tennis?
The final chart in this article compares expected yield with actual yields. For the blue dots and trend line, the expected yield is implied by the opening to closing odds ratio, after the margin has been removed from the closing odds. The actual yield is calculated from betting opening prices
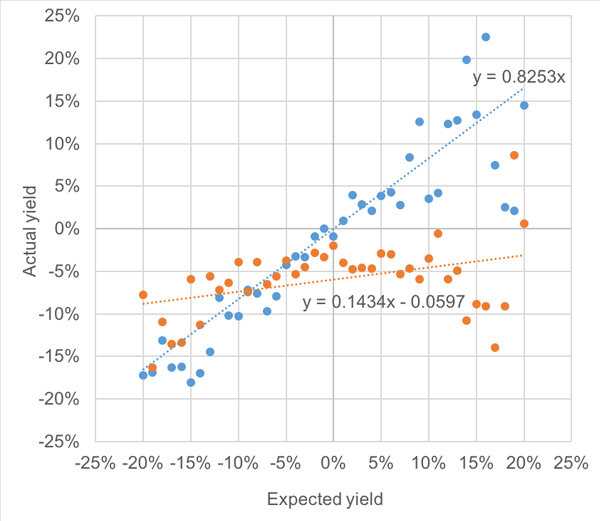
A perfect correlation between expected and actual yields would show a trend line gradient of 1. In fact, it is less (0.825). The implication is that the opening to fair closing price ratio is not a perfect predictor of profitability and that closing prices therefore cannot be wholly efficiency or accurate.
Since the gradient is less than 1 this also implies that opening prices to do not fully converge to price equilibrium. In other words, prices that are too long do not shorten enough by closing; prices that are too short do not lengthen enough. I have attempted to explain such a phenomenon by price anchoring although there may well be others, including bookmaker price manipulation as I have mentioned.
Such a finding is consistent with @nishikoripicks failing to beat the closing price by the predicted amount. However, rather than this implying his profitability is more through luck than design, it could simply mean that Pinnacle’s tennis match betting prices he advises don’t fully reach their ‘true’ values by closing.
For the red dots and their trend line, the expected yield is implied by the closing price to fair (margin removed) opening price whilst the actual yield is calculated from betting closing prices. If closing prices were perfectly efficient this line would be horizontal with a gradient of zero.
The fact that is it weakly positive (ideally the blue and red line gradients should sum to 1) implies again that they are not, and further that there remains some residual information in the opening price that is predictive of actual outcomes.
Is @nishikoripicks a skilled tipster?
The data shows that @nishikoripicks beats the closing price on average by about 3%. If the closing line value hypothesis is correct this implies that after the influence of Pinnacle’s margin is removed, he has roughly a break-even expectation. Yet he actually has a 9% yield from 3,000 tips.
We now know that the tennis betting market may not be wholly efficient, at least not as efficient as soccer. We could speculate on the reasons for this. In addition to price anchoring or price manipulation, others might include the lower market liquidity and, for this analysis, the inclusion of lower ranked Challenger and Futures tournaments which have far less available information about competing players than the major ATP and WTA competitions.
Whatever the reasons, it might be reasonable to conclude that using closing prices in tennis might not offer a perfect means of predicting tipster or bettor performance.
The difference between break-even and 9%, nevertheless, is large, too large to be explained solely by the rather minor deviation from price efficiency observed in this analysis. Other explanations will be needed.
One may simply be that Pinnacle is unaware of @nishikoripicks’ activity. Another could be that both he and Pinnacle have very similar pricing models that exploit the biases and ignorance of square bettors.
From Pinnacle’s perspective, it’s more profitable to resist the temptation to move to ‘true’ closing prices so long as squares will continue to bet the wrong side of inefficient lines. From @nishikoripicks’ perspective, it will misleadingly look to followers of the closing line value hypothesis that he has simply been lucky.
Luck is not something we can ever completely rule out in betting. However, the longer that @nishikoripicks manages to sustain his performance well in excess of that predicted by the closing line value hypothesis, the more we will have to accept that it’s time to re-evaluate the use of the closing line as a predictor of ‘truth’, for smaller sports markets like tennis at least.
About the author