All bettors have to deal with losses, no matter how skilled they are. Some bettors may experience losing runs that are longer than others, but how long can we expect a losing run to last in betting? Read on to find out.
- What is the probability of losing?
- The expectation of losing sequences
- Analysing losses with real world betting histories
Winning a bet is a nice feeling. Losing, however, is considered to be twice as painful, psychologically speaking, as winning is enjoyed. Frequently, a bettor’s response to losing, particularly a run of losses, can lead to reckless behaviour, either betting more often or betting more money, in an attempt to recover their losses.
Even for potentially skilled bettors with positive expectation on their side, losing runs could lead them to irrationally question the efficacy of their betting system. It’s much easier to doubt yourself after 10 from 10 losing bets than it is after 10 from 10 winning ones, even though in statistical terms they will have very similar outcome probabilities. Hardly anyone would bother to question an over-performing system.
I’ve previously written about betting drawdowns and how they can be managed. In this article, I want to complement that work with a simple modelling of losing runs, and more specifically how long we might expect one to last.
I have limited myself here in order to keep things simple. I will use a consecutive run of k losing bets in a sample of n bets with the same odds, although there is no reason why one couldn’t extend this to cover more complex losing periods and more complex betting records with variable betting odds using a Monte Carlo simulation. At least with the simplest losing run, however, we can offer some basic mathematical formulae to describe them, difficult with more complex scenarios.
The probability of losing
Let’s consider a bettor who is skilled enough to break even over the long term. In other words, they are achieving fair odds. As such the odds will then reflect the ‘true’ probability of a result. In fact, what follows doesn’t really change very much for either unskilled bettors betting to the margin, or skilled bettors managing to find marginal profitable expectation, the reason being that the vast majority of what happens in betting is a consequence of randomness. Odds of 2.0 imply a 50% probability, odds of 4.0, 25% and so on. The probability of winning k consecutive bets each with odds o is then given by:
![]()
For example, the probability of winning five consecutive fair even-money bets with odds of 2.0 is 1/32.
But here we are interested in losing bets. For odds of 2.0, the odds of losing would be the same, also 2.0, since the probability for winning or losing is both 50%. More generally, the odds of winning and losing are not the same. Given that the probability of losing is 1 minus the probability of winning, it follows that the odds of losing are given by the expression:

Thus, the probability of losing k consecutive bets each with odds o is given by:

The expectation of losing sequences
What is the probability of having k (or more) consecutive losses in a sample of n wagers of odds o? It turns out that the mathematics for this is not trivial, and well beyond my pay grade. But we can ask the question in a slightly different way, and for that the mathematics is much easier. Instead, let’s ask how many times we can expect to lose k consecutive times in a sample of n bets of odds o?
Consider a simple example. How many times can we expect to lose three bets in a row, each with odds of 2.0, in a series of 10 bets. We already know that the chance of singularly losing three in a row is 1/8. However, in a series of 10 bets there are numerous opportunities to build a three-bet losing sequence. It could happen on bets one, two and three, or on bets two, three and four, and so on up to bets eight, nine and 10.
In this example there would be a total of eight possible sequences, so the expected number of time we would have such a sequence in 10 bets is 8/8 or one. In other words, on average we would expect to have one three-bet losing sequence every 10 bets. Sometimes there will be more, and sometimes there will be none, but the average will be one.
More generically, the number of possible sequence positions in a series of n bets is n – (k – 1) or n – k + 1.
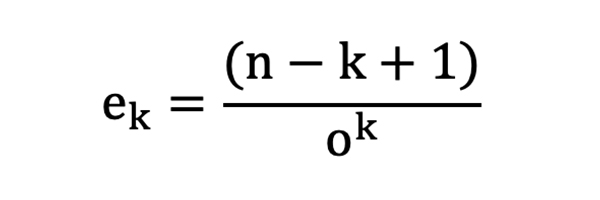
Hence the expected number of losing k consecutive bets, let’s call it ek, in a sample of n bets will be given by:
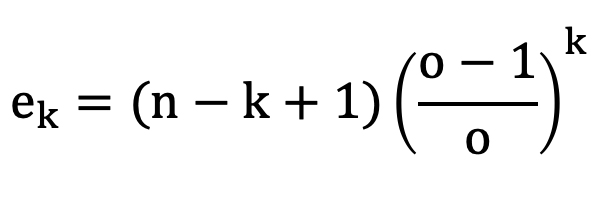
As the number of bets, n, increases, for smaller values of k (and k will always be much smaller than n for losing sequences that are realistically possible and which we are interested in), ek will tend towards:
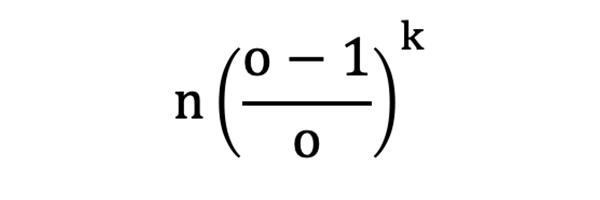
For a sample of 1,000 bets with odds 2.0, for example, the expected number of five-bet losing sequences will be 31.25 (31.125 using the more precise formula), rounded to 31 as the nearest integer number.
Since the number of bets, n, is roughly proportional to the expected number of losing sequences of length k, we would expect about 62 five-bet losing streaks in 2,000 bets, and around 93 in 3,000 bets.
When ek = 1, we can describe k as the length of the longest losing sequence that one will typically expect to see in a sample of n bets. Why? Well, less than 1 and we don’t see it and more than one, and there is opportunity for a longer sequence of losses to occur fewer times.
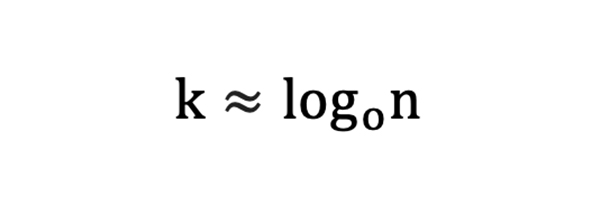
Thus, when n >> k and ek = 1:
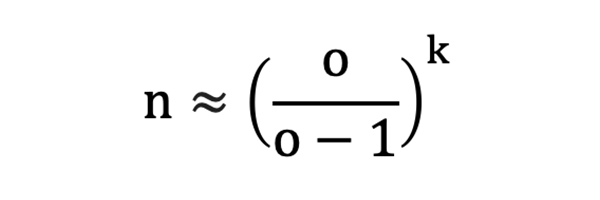
And rewriting:
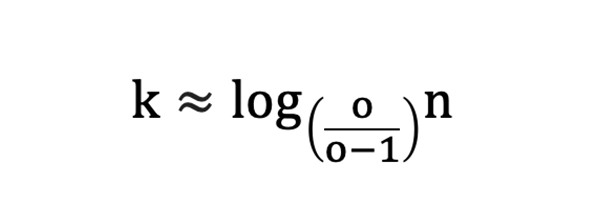
where ![]() represent the base of the logarithm.
represent the base of the logarithm.
For 1,000 bets with odds of 2.0 the expected longest sequence of losses will be log21000 = 9.97 or 10 to the nearest integer. In other words, in a sample of 1,000 bets we can typically expect the longest losing sequence of losses to comprise 10 bets.
For odds of 3.0, the expected longest losing sequence would be 17, and for odds of 5.0, 31. Odds of 5.0 are quite typical for racing bettors. Do you think you could handle a sequence of 31 consecutive losers without getting cold feet about what you were doing?
I’ve run a 10,000 iteration Monte Carlo simulation to test the mathematics for ek. The table below compares the results for different values of k. There is an almost exact match between the predicted occurrences of losing sequences based on the mathematical formula above and the Monte Carlo simulation.
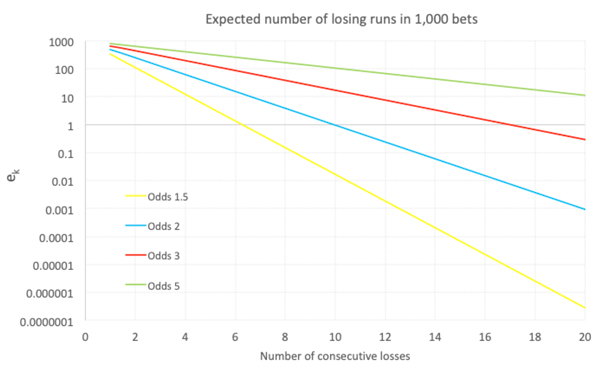
In the chart below I’ve plotted the relationship between k and ek for different win odds. The y-axis, ek, is logarithmic. The straight line confirms that k is inversely proportional to the logarithm of ek which is exactly as would be expected given the mathematics. The point at which each line crosses the x-axis (at ek = 1) is the expected longest losing sequence.
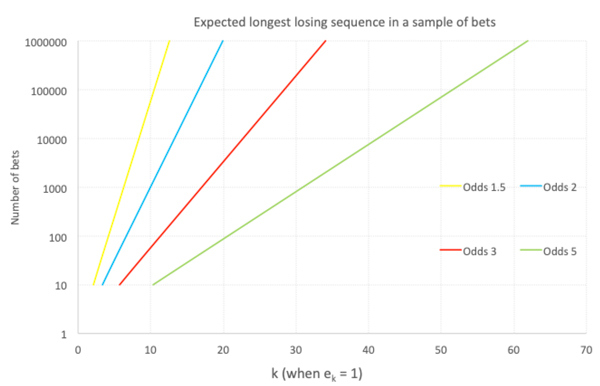
Given the approximation for k above, the expected longest losing sequence in a sample of n bets is thus also proportional to the logarithm of n, as depicted in the next chart. Thus, k doubles with each squaring of n.
The probability of a losing sequence
Knowing expected numbers of losing sequences is one thing, but we still don’t know the probability of them happening. As mentioned previously, the mathematics for this is non-trivial because the frequency (probability) distribution for the number of losing sequences of length k in n bets is not at all obvious and will be different for each vale of k.
For example, we might know that on average we will see about one losing sequence of 10 bets in a sample of 1,000 even-money bets, but that’s just the average. Often, we will see none, sometimes two, occasionally five or more. Instead it’s much easier to resort to our trusty Monte Carlo simulation.
With a 10,000 iteration Monte Carlo simulation I counted the number of times each losing streak of length k was not observed. For example, for k = 10 in a sample of 1,000 even-money bets the maximum losing sequence was shorter on 6,086 occasions, and 10 or more on the remaining model iterations.
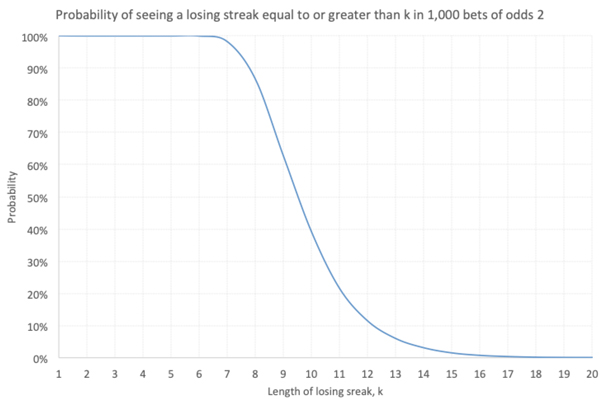
Relying on the law of large numbers this implies that seeing a losing sequence of 10 or more bets has a chance of roughly 39%. This seems intuitively about right when we remember that the expectation is to see a 10-bet losing streak about once in such a sample. The chart below shows how the probability of seeing a losing streak of length k or more varies with k.
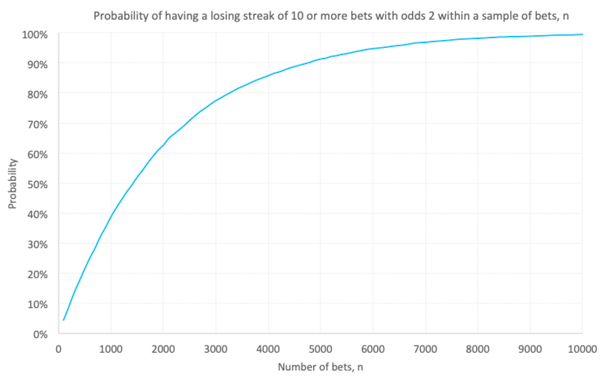
Evidently the larger the sample of bets, the more likely it is that something bad is going to happen at some point. We know that the probability of 10 consecutive losses in 1,000 even-money bets is 39%. What would it be for smaller or larger samples? I ran another Monte Carlo simulation to find out. The chart below is for k = 10.
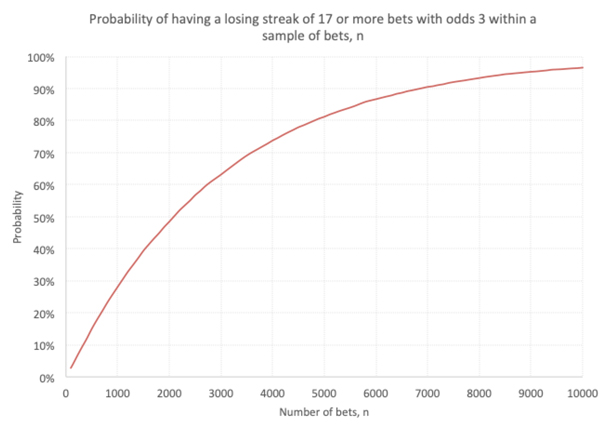
We can re-run our model for any value of k or any set of odds. Another example output is shown below for odds of 3.0 and a losing streak of 17 or more.
Analysing losing runs with real world betting histories
Thus far, this analysis has been rather theoretical in that it considers only samples of bets where the odds are all the same. That might be a reasonable assumption for point spread and Asian handicap bettors, but less likely for money line and fixed odds bettors who may be betting a much wider variation of odds. For example, my Wisdom of the Crowd betting system has matches with odds as short as 1.11 and as long as 67.0, an average of 3.9 and a standard deviation of over 4.
Certainly, we could use a Monte Carlo simulation to determine our expected loss sequences, but is there a way to use the mathematics? Yes, we simply need to be careful we use the appropriate value for o, the odds. We cannot use the average odds for our sample because this will be disproportionately weighted towards the longer odds.
- Read: Why do we gamble?
Instead we should use the inverse of the average of the implied probabilities for all odds. For example, if our sample has five bets with odds of 2.0, 3.0, 5.0, 10.0 and 20.0, calculate the implied probabilities (0.5, 0.333, 0.2, 0.1 and 0.05), take their average (0.237) and invert (o = 4.23).
I performed this for my Wisdom of Crowd sample history, a sample of 9,436 bets. With a calculated value of o = 2.66 using the method above, there was an excellent match between the expected values for k and actual losing sequences.
The maths predicted 898 losing sequences of at least five bets, but there were actually 889 of them. Likewise, for k = 10, the maths predicted a figure of 85; there were exactly 85. For k = 9, prediction was eight, actual was nine. The expected longest losing sequence (ek = 1) was predicted to be 19. The longest losing sequence was indeed 19, and there was just one.
What about winning sequences?
We can use the same mathematics to analyse the expectation of winning sequences. Indeed, it is even simpler since we can use the win bet odds directly in the formulae rather than adapt them to reflect the odds of a loss. Hence:
And for ek = 1:

However, for samples of variable odds, don’t forget to use the appropriate figure for o, not the average odds, but the inverse of the average of the implied probabilities.
What have we learnt about losing runs in betting?
Given enough time, bad things happen in betting. If nothing else, hopefully this rather theoretical analysis of betting sequences will serve as a reminder that the longer you bet for, the more likely it is you will see longer and longer losing streaks.
In addition to finding expected value, the task for any successful bettor is to manage their expectations sensibly and learn to cope with the inevitable bad runs that have the capacity to significantly influence bettor psychology. Knowing what to expect and how to estimate it at least gives you some preparation in that respect.
About the author