- Analysing a real betting record
- Can beating the closing line happen by chance?
- Closing line value versus profits and losses
I’ve previously published an article on Pinnacle’s Betting Resources outlining how a bettor can test for the evidence of forecasting skill. By comparing what profits a bettor has actually achieved with what could have happened by chance, we can begin to form a judgement as to whether the record is too unlikely to have happened randomly.
The drawback of this approach is the time (or rather the number of bets) it can take before we can form more concrete opinions.
A bettor typically betting prices of around 5.0, for example, might take 2,500 bets before they could be confident that such a performance probably wasn’t just lucky – if they were to make five bets per day that would take more than a year. Unfortunately, the spread of possibilities due to chance is wide, and it takes a long time for the law of large numbers to exert its influence.
Fortunately there is an alternative approach, and it’s one that I’ve touched on previously when I looked at what the closing line can tell us about profit expectation. There is convincing evidence that the margin by which you beat the closing line (or odds) is a reliable predictor of your profitability.
To investigate how and why a bettor can be beating the closing price like this, we should start by estimating the likelihood of it happening by chance.
Beat the closing line by 10% and you should expect to make a profit over turnover of 10% over the long run, implying that the closing line accurately reflects ‘true’ chances of sporting outcomes. Such odds are said to be efficient.
Certainly, there are profitable bettors failing to beat the closing line who therefore argue against this hypothesis. For these there must then exist two possibilities: either they are wrong, lucky. and will regress to the mean. Alternatively, the efficient closing line hypothesis is not quite right, and there are lines, systematically identified by such bettors, that have failed to reach the ‘true’ prices.
In this article I don’t intend to address the potential weakness of this hypothesis, suffice to say that I have previously discussed a possible way closing odds could systematically (that is to say non randomly) deviate from full efficiency. This, perhaps, is for another time.
Instead in this article I want to look at how we might theoretically use the closing line to test for bettor skill, given that the efficient closing line hypothesis is true. After all, Marco Blume, Trading Director at Pinnacle, has said that the closing line is on average very, very accurate, that the sharps are beating it, and his traders are trying to achieve the most efficient line with the information they have available. For the purposes of what follows, let’s take him at his word.
Analysing a real betting record
The following chart shows the level stakes profit history of real bettor, consisting of 1,214 bets over an 11-week period at the start of 2019, with average betting odds of 2.065 and a profit over turnover of 5.73%.
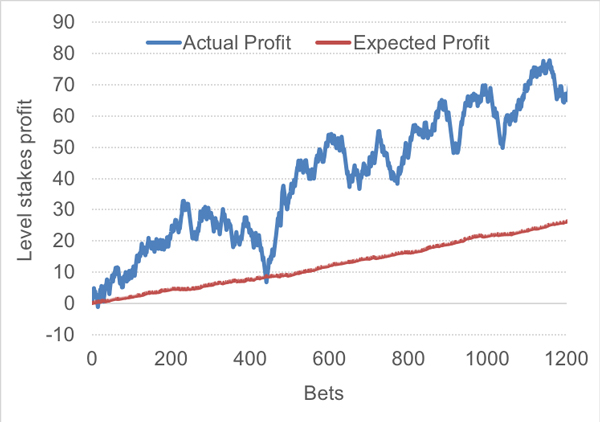 The blue line shows the actual performance, the red line the expected performance. Clearly, the actual record has overperformed relative to expectation. How did I calculate the expected profit?
In their betting history, the bettor has diligently recorded all prices they placed and all closing prices for those bets. As mentioned earlier, the ratio of these two prices offers us a reliable estimate of the bettors expected advantage. Of course, both prices contain the bookmaker’s margin. We need to remove it from the closing price to calculate an estimate of the ‘fair’ ‘true’ price, assuming full price efficiency at market closure.
In removing the margin I have also taken into account the favourite-longshot bias, which sees longshots attract a greater weight of the bookmaker’s margin than favourites.
The first bet in the series, for example, was placed at 2.13. It closed at 1.85. After the bookmaker’s margin is removed, the ‘true’ closing price was 1.89. Consequently, the expected advantage the bettor held was 2.13/1.89 = 12.8%. This is to say for every 100 such 1-unit bets that might be placed, a profit of 12.8 units could be expected to be made.
The average advantage held was 2.19%, implying an expected profit over turnover of 2.19%. The average ‘fair’ closing price was 2.024.
Can beating the closing line happen by chance?
To investigate how and why a bettor can be beating the closing price like this, we should start by estimating the likelihood of it happening by chance. To do this I’ve drawn again on a population of 162,672 soccer match betting opening and closing odds from Pinnacle which I analysed in one of my previous articles.
From this sample, 35.7% of home and away opening betting odds (with average and median values of 3.443 and 2.75 respectively) theoretically held a profitable advantage over their ‘fair’ closing prices. The average ratio of opening to ‘fair’ closing price for this sample was 0.969%, implying an expected level stakes loss over turnover of -3.1%
If we randomly picked 1,214 bets from this sample, we should expect the average ratio to be 0.969. Of course, we wouldn’t always get 0.969, just as we don’t always get 10 heads and 10 tails when we toss a coin 20 times. How likely might it be to randomly pick a sample that showed an average ratio of 1.000, implying a break-even expectation?
Marco Blume, Trading Director at Pinnacle, has said that the closing line is on average very, very accurate, that the sharps are beating it, and his traders are trying to achieve the most efficient line with the information they have available.
We can answer this question if we know the standard deviation in opening/’fair’ closing price ratios. In this sample it was 0.114 (or 11.4%), meaning about two-thirds of individual odds ratios lay between 0.855 and 1.083, as defined by the normal distribution.
With this information we can estimate what the standard deviation in the average price ratio of a sample of 1,214 would be. This is to say, if we had a large number of 1,214-bet samples with odds like the ones in my population here, we want to know the standard deviation in the average price ratio across those samples.
Readers of my article on modelling your possible betting returns may recall that the standard deviation in a betting metric average, like yield or in this case opening to closing price ratio, is inversely proportional to the square root of the number of bets. Hence, the standard deviation of average price ratio here can be calculated by dividing 0.114 by the square root of 1,214. The answer is 0.0033.
In other words, for samples of 1,214 bets with odds like my population here, about two-thirds will lie between 0.966 and 0.972. With this figure we can now calculate the probability that an average opening price to ‘fair’ price ratio of 1.000 in a sample of 1,214 bets would happen by chance, given an expected value of 0.969. The answer is effectively 0% (in fact about 1 in 100 million trillion to be more precise). Given that 1.000 is over nine standard deviations away from 0.969 this result will hardly come as a surprise to anyone familiar with the statistics of the normal distribution.
Evidence of skilled bettor
The implication of this analysis is clear. If a bettor were to show an average bet price to ‘fair’ closing price ratio of 1.000 when the expectation is 0.969 in a sample of 1,214 bets, this categorically cannot have happened because of luck. Instead, the explanation must be causal; the most obvious is bettor skill and the bookmaker reacting to it by shortening their odds. If that is not the explanation, we still need another causal one; to reiterate, it can’t be good luck.
Let’s return to our real bettor and their record. Firstly, we should recognise that their average odds, 2.065, are significantly different to the average odds in my analysis population, 3.443. How does this change the calculations?
The longer the odds, the more they are likely to move. Again, that’s not a surprising observation. If we move a 80%/20% proposition by 5% to 75%/25%, the favourite will move from 1.25 to 1.333 (a ratio of 0.9375) whilst the underdog will move from 5.0 to 4.0 (a ratio of 1.25). In fact, the standard deviation in opening to closing price ratio is proportional to the logarithm of the odds. Odds of 1.25 typically saw a standard deviation of about 0.043, whilst odds of 5.0 had a value of about 0.14.
Similarly, the average opening to ‘fair’ closing price ratio changes with average odds, falling roughly linearly as the odds increase. Odds of 1.25 show an average ratio of about 0.99, whilst odds of 5.0 show a figure of about 0.95.
There will still be bettors with profitable records who fail to beat the closing line who will say: “doesn’t my record simply prove that the efficient closing line value hypothesis is invalid for the purposes of estimating expected profitability?”
The bettor’s average odds of 2.06 would have a standard deviation of about 0.079 and around an average of 0.98. Dividing this standard deviation by the square root of 1,214 gives us a figure of 0.0022, so again a ratio of 1.000 is about nine standard deviations away from the expectation of 0.98.
Finally, we should remember the bettor here didn’t just match the ‘fair’ closing price on average. They beat it by 2.19%. The chances of doing that when the expectation is -2.0%? About one in a quattuorvigintillion (1 with 75 zeros) or about 18.5 standard deviations. This bettor was moving lines, and that is because the bookmaker recognised them as someone with better knowledge than the rest of the market at the point they bet the published odds.
It’s worth briefly reminding readers that I have also previously attempted to model how often a bettor would theoretically need to beat the ‘fair’ closing price to have any profitable expected value at all. The figure I came up with was about 70%. Our bettor beat the ‘fair’ closing price 73.5% of the time (beating the published closing price 84.2% of the time).
Closing line value versus profits and losses
Let’s look back at the bettor’s actual profits/losses (P/L) history above. Using my traditional significance testing approach, such a performance could arguably happen by chance about once in 200 bettors. On that evidence it’s probable that something more than luck is at work, but if we had a sample of 200 bettors and this was the best record, we couldn’t really rule out the possibility that there was no skill at all.
Compare this to the closing line value (CLV) methodology I’ve described above. One in 200 versus one in a quattuorvigintillion. Which is giving us more reliable information about the likelihood of the bettor’s skill?
The chart below compares the two approaches for a bettor betting odds of 2.00, illustrating how much faster the CLV methodology provides meaningful information to the bettor about their chances of being a long-term winner with an expected advantage of 2%. The y-axis is logarithmic, measuring the chances that an expected/actual profit over turnover of 2% will happen by chance for the CLV and P/L methods respectively.
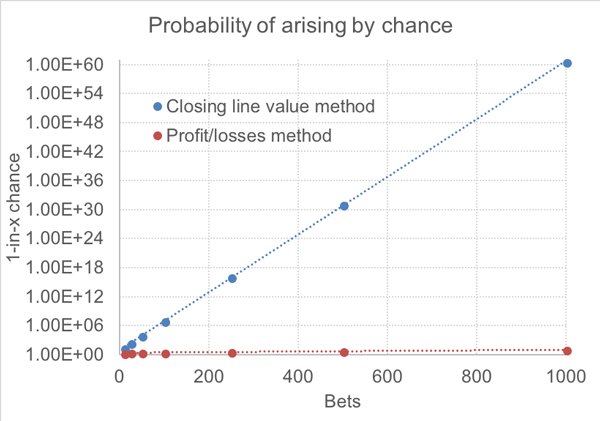 In comparison to the CLV method, using actual profits and losses barely even registers. Even after 1,000 bets there’s only a one in 10 probability that luck could have delivered a 2% profit where the expectation is a 2% loss. Statisticians testing hypotheses wouldn’t even blink. Should such a bettor be showing an expected yield of 2% based on how they beat the fair closing prices of bets they make, just 50 of them would provide the confidence of knowing that this would happen once in about 10,000 times.
Of course, you might justifiably point out that profits and losses are real and closing lines just give us an idea of what to expect. By this measure, our bettor did very well with close to a 6% yield. The key point here, however, is that it takes much longer to separate randomness from causation with profits and losses than it does for closing line value.
Provided the closing line value hypothesis is correct (it might not be completely so, but that is for another day), it provides a much more reliable indicator of bettor skill than a mere betting history. Arguably, beating the ‘fair’ closing line tells us much more about the long-term expectation for this bettor. Possibly two-thirds of our bettor’s actual profitability over 1,214 bets presented in this article was down to luck. Over long term they can be expected to regress back towards 2.19%.
Conclusion
I know there will still be bettors with profitable records who fail to beat the closing line who will say: “doesn’t my record simply prove that the efficient closing line value hypothesis is invalid for the purposes of estimating expected profitability?” Yes, it might, but there are two points that must be taken into consideration.
Firstly, if a bettor is beating the closing line in the way our bettor in this article has done, we have to explain it. Chance alone cannot do that as the numbers have proved. The obvious answer is they’re skilled and the bookmaker knows it.
Consequently, if one profitable bettor can move lines, why not another? Unless such a bettor can offer reasonable and testable explanations for why they don’t, the likelihood must remain that they’ve simply been lucky. Remember, you might have a 1-in-a-million betting record, but if you’re the best in a million trackable bettors, what does that really mean?
Provided the closing line value hypothesis is correct (it might not be completely so, but that is for another day), it provides a much more reliable indicator of bettor skill than a mere betting history.
Secondly, given this information, the closing line acts as a gauge, allowing the bettor to very quickly measure their expected performance. Since even small deviations from expectation are highly unlikely over samples as few as 50 bets, the bettor will be able to very swiftly identify if the market thinks they’ve lost their edge. That’s something completely impossible with profit/loss analysis alone. In the words of our bettor here, “I can use CLV as a cliff detector, that way I can slow down, or I can change my direction, so I don’t fall off.”
Until bookmakers show us the data on profit/losses versus closing line value we’ll never know for sure how reliable an indicator CLV really is. Much of my data analysis into it published in Pinnacle’s Betting Resources over the years suggests that if it’s not perfect, it’s surely pretty good.
After all, Marco Blume has told us that sharps move lines. Who am I to argue with that? So, if you are mindful enough to keep a record of your betting odds, keep the closing prices too, and you can determine very quickly if your bookmaker and the market think you’re a winner.