Related Articles

Having already analysed whether bookmakers take positions on points spread markets, Joseph Buchdahl has now turned his attention to the NBA Total Points market. Read on to find out if there is a bias in certain NBA betting markets that bookmakers can take advantage of.
- Why might bettors prefer the over?
- Are some points totals more biased than others?
- Do bookmakers take advantage of Total Points biases?
Last month I published a two-part article investigating why bookmakers might consider biasing a point spread betting market that deviates from perfect efficiency. Bookmakers are in the business of making profit. If they can do things to increase that beyond their published overround, why wouldn’t they?
If bettors over-bet one side of a market more than the other, bookmakers can increase their returns by biasing the spread against bettors’ preferences, provided bettors don’t notice. This notion becomes more interesting when you consider previous academic research has revealed that bettors may have a tendency to over-bet a point spread favourite.
Reviewing the evidence from a historical NBA data set, I found that the biggest handicap favourites did indeed cover their spreads less than 50% of the time. If bettors were over betting these spreads, the bookmaker would definitely be increasing his returns. However, in general favourites and underdogs as a whole performed no differently.
What about a total points betting market? Pinnacle have reported BetShare figures – the percentage of customers betting one side or the other – for many of their markets on their twitter feed. When I analysed these figures, I found that for every sport – NHL, NBA, MLB, NFL, football and tennis – the share of bets on the ‘over’ was always greater than those on the ‘under’.
Across 334 games, the average ‘overs’ BetShare was 62%. Whilst we can’t be sure that this asymmetry translates into betting volume as well, the implication is that bookmakers may have a profit incentive to bias a total points market in the same way as for a point spread market. In this article, I aim to review the evidence from the same NBA data set used last month.
Why might bettors prefer the over?
Why might bettors prefer betting ‘over’ on a total points or total goals market? One possible explanation is loss aversion, the tendency for people to strongly prefer avoiding losses in comparison to acquiring gains.
Consider the nature of an over/under bet. By its very nature, the ‘under’ is automatically a winner at the beginning of a match, remaining so until such time as enough points (or goals) are scored to transform it into a loser. In contrast, the ‘over’ starts out as a loser and remains so until such time as enough points (or goals) are scored to transform it into a winner.
If bettors are sensitive to loss aversion in this context, they may conceivably prefer the possibility of seeing a loser transformed into a winner rather than the other way around.
Psychologists have argued that losing hurts about twice as much as winning is enjoyed. If that is so, we might reasonably expect about twice as many bettors to favour ‘over’ (‘losers into winners’) in preference to ‘under’ (‘winners into losers’). The observed BetShare percentages would then seem to make sense.
Are bookmakers exploiting biased NBA total points bet shares?
Within my sample of 334 bet shares, the sub sample of NBA matches showed a 64%/36% split in favour of the ‘over’. If those figures were also representative of the share of money wagered, then biasing the market by only 1% (49%/51% winning ‘overs’ versus winning ‘unders’) would increase returns of a theoretical 2.5% profit margin to 3.0%, and to 3.6% for a 2% bias. Is there any evidence for it?
Using the same 12-season 15,508 NBA match sample as for my point spread bias analysis, 7,553 matches (or 48.7% of the total) finished with points totals over the closing price quote, 7,750 (or 50.0%) finished with points totals below the closing quote, whilst 205 (or 1.3%) matched the quote exactly.
Discounting the 205 matches which exactly matched the bookmaker’s closing market prediction, this represents a 49.4%/50.6% split in the direction we would have predicted by the initial hypothesis.
It is not, however, statistically significant, with a p-value of 0.11 (or 11%) for a chi-square test; that is to say, 11% of the time this result could occur by chance assuming the bookmakers were not intentionally biasing their NBA total points market against the ‘over’. P-values of at least 0.05, and preferably 0.01 or even 0.001 are desired before we might reasonably rule out the possibility that only chance is operating.
This is not to imply, however, that the bookmakers are not biasing their NBA total points market. Should such a split persist over a much larger sample of matches, statistical significance would eventually be achieved. Nevertheless, from this data alone we can’t confirm that such a biased market is a real phenomenon.
Are some points totals more biased than others?
As for the point spreads, let’s not give up just yet. Can we find any more significant biases for different points totals? Perhaps bettors disproportionately prefer betting ‘over’ on higher points totals matches – let’s have a look.
The chart below shows the cumulate percentage of winning ‘overs’ and ‘unders’ with matches in descending order of the published closing odds points total. Ignoring the small-sample-size fluctuations at the start, those matches with above-average (203 points) closing lines see proportionally fewer winning ‘overs’ compared to matches with below-average closing lines.
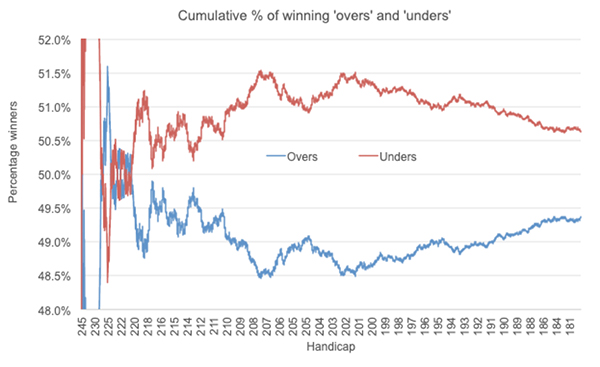
Of the 7,530 matches with closing lines over 203, 48.8% were winners (and 51.2% losers), excluding the 205 matches whose game totals matched the closing line exactly. This deviation from 50-50 expectation is weakly statistically significant (chi-square test, p-value = 0.04). By contrast, for the matches with closing lines 203 or below, the split was 49.9%/50.1%.
Evidently, however, it is difficult to argue from the chart that the bigger the total points line, the more likely it is that a bookmaker will be biasing it against the ‘over’. The highest line totals above 225 points, for example, actually see winning ‘overs’ more than 50% of the time. This could be a consequence of smaller sample variance. Alternatively, it could imply a much more complicated picture than the simple one of bigger ‘overs’ having more biased lines.
As for the point spreads we could choose to test statistical significance at any point in the chart. This is shown below for the chi-square test p-value.
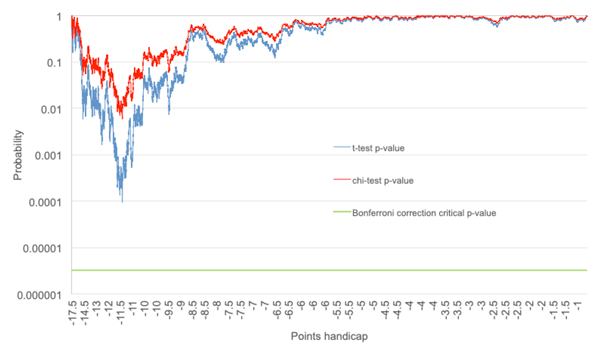
Yes, there are points in the time series where the probability of the divergence from 50-50 expectation happening by chance is small (<1%). It is doubtful, however, whether at any of these are truly meaningful if we were to apply the Bonferroni correction to account for the multiple chances of finding anything statistically significant.
Do bookmakers take advantage of Total Points biases?
A potentially significant caveat to this analysis, and for the point spread analysis last month, is that the line data came from a number of bookmakers, not a single one.
It is possible, although not provable here, that different contributing bookmakers to this data set behave in slightly different ways with regards to how they might treat an NBA line. If any of these are conflicting, the general picture that may arise from analysing their data collectively may ultimately reveal a misleading picture.
More generally, as for the point spreads there is a tantalising suggestion that bookmakers will manipulate some of their total points lines in an NBA betting market to exploit unsophisticated bettors, in an attempt increase their returns above the published profit margin, but this analysis can neither confirm it beyond doubt, nor completely rule it out. Real or otherwise, from the bettor’s perspective the size of any bias, anyway, is barely enough to cover the bookmaker’s margin on average.
What deliberate biases may exist would appear to be small in nature, and on average at least NBA totals betting lines are close to being market efficient.
About the author