Related Articles

When making tennis predictions, particularly in-play, bettors should strongly consider the impact momentum can have on the result. In his latest article, Jonathon Brycki builds a model to understand and price momentum between sets in a tennis match.
- How significant is momentum in tennis?
- How to analyse momentum between sets
- In-play tennis betting guide
In a previous article, I explained how to build a tennis pricing model using players’ serve percentages. I showed how this model could be used to price games, sets and matches. The model was limited in that it didn’t account for momentum within a match, and therefore wasn’t able to be extended to price totals and handicaps.
This article extends the previous model with the aim of understanding and pricing momentum between sets in a tennis match. I again use serve percentages as the basis for this model.
Set momentum
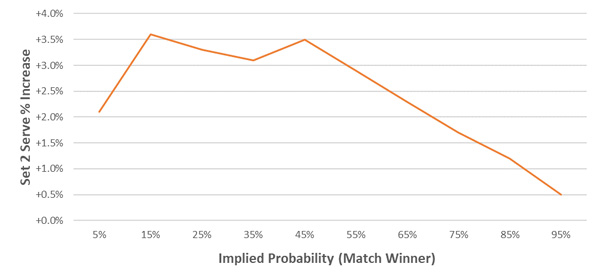
Momentum is a significant factor during a tennis match. In the article Set Betting Odds and Stats, I showed that a player is more likely to win set two if they have won set one (after their pre-game odds have been accounted for). The average outperformance was 16% in all ATP matches since 2010. The chart below plots this relationship.
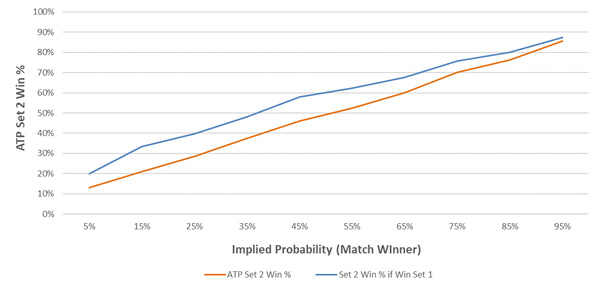
The effect generally decreases as a player’s implied probability increases. That is, longshots tend to carry momentum into set two better than favourites.
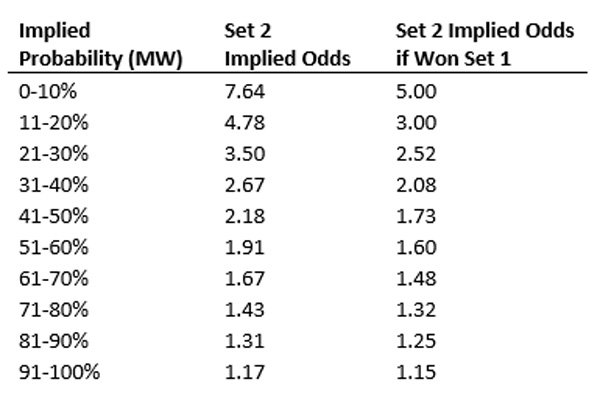
By expressing this chart in implied odds, we can clearly see this relationship. For example, a player whose odds imply an 11-20% chance of winning the match should, on average, have fair odds of 4.78 for set two. If they have won set one however, their fair implied odds for set two are actually 3.0, on average.
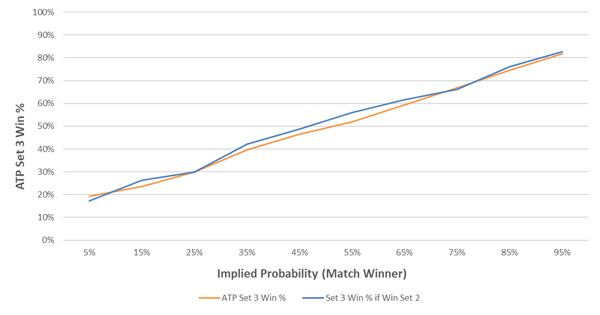
Similarly, the player who wins set two to level the match at one set all is more likely to win set three. There is less of a momentum effect between sets two and three than between sets one and two. The magnitude of the effect is, on average, just 1.4%.
What this momentum between sets means for our tennis pricing model, is that we need to update baseline probabilities (and therefore serve percentages) to account for what we can expect to transpire throughout a match. Let’s first analyse the momentum effect between sets one and two.
Momentum between set one and set two
Previous analysis showed that match and set winner probabilities can be modelled using the difference in players’ serve percentage. The chart below plots how a difference in service percentage translates to likelihood of winning a set. For example, a player who wins 4% more points on serve than their opponent is expected to win 64% of sets.
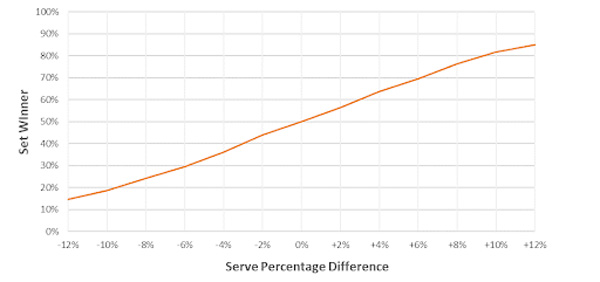
We can use this relationship to express the set two win probability conditional on winning set one as the corresponding increase in serve percentage. This is shown in the chart below. For example, if a player with a pre-game match winner implied probability of 65% (implied odds 1.54) wins set one, their set two serve percentage should increase by 2.3%.
Momentum between set two and set three
Given no discernible trend across the range of implied probabilities, I assumed a constant 1.4% advantage in set three, for the winner of set two. This equates to a 0.45% serve percentage adjustment from pre-game serve percentages.
How does the model look?
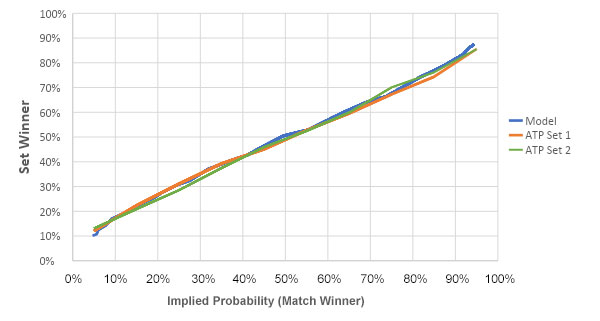
I simulated the model for 150,000 matches by varying the players’ serve percentages. The chart below plots the relationship between the model’s match and set winner probabilities. Also shown is this relationship in the ATP, plotted using all matches since 2010. The model appears to provide a good estimate of actual set outcomes.
Next, let’s consider the conditional relationships for set two and set three given a win in set one and set two respectively. The chart below compares the model to all ATP matches since 2010.
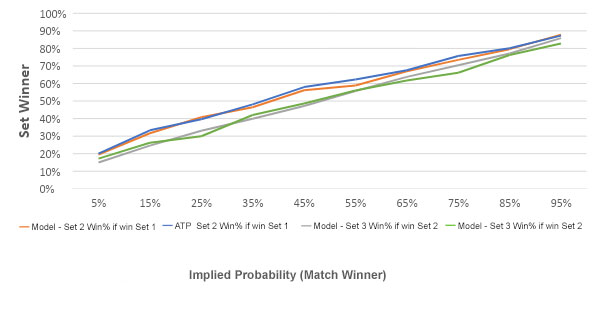
Again, the model appears well calibrated. The next step is to understand how accurately this model prices totals and handicaps. While the dataset I used for the analysis doesn’t contain total and handicap odds for each match, we can compare actual match outcomes to the model’s simulations.
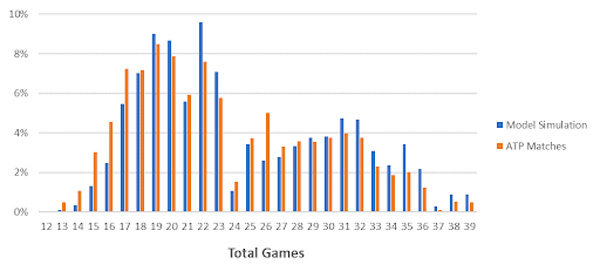
Let’s first consider closely priced matches – where the players’ implied probabilities are between 40-60%. I simulated 30,000 matches (around the ATP’s long-term average serve percentage of 64%) and recorded the totals and handicaps. These are compared to the over 6,000 ATP matches since 2010 that fall in this implied probability range, in the charts below.
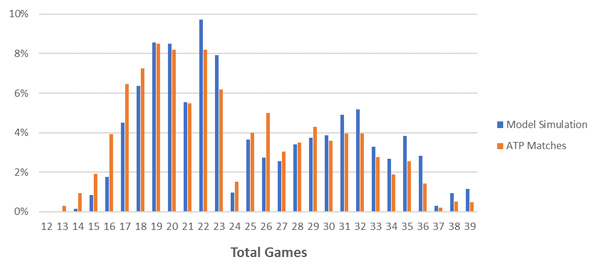
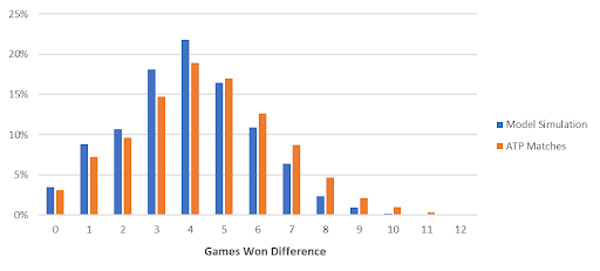
While the model seems to be reasonably calibrated, you will notice it underestimates totals between 12 and 18 games (the loser winning six games or less) and overestimates totals over 30.
The other major divergence is the overestimation of totals 22 and 23 and the underestimation of 26 totals. Correspondingly, the model overestimates low handicaps and underestimates high handicaps.
What about for more unevenly priced matches? The chart below plots game totals for implied probabilities between 60-80% (20-40% for their opponent).
It appears that the model’s deficiency remains. What’s going on here? The discrepancy seemingly shows that updating serve percentages (and thus probabilities) only at the end of each set isn’t dynamic enough. Ideally, serve percentages require constant adjustment after every game, if not, point.
If a player is leading 3-0 in the first set, not only should the players’ serve percentages be updated for set two but also for the remainder of set one. A 6-2 first set would therefore have a greater impact on second set odds than a closer 7-5 set, for example.
Quantifying and incorporating these factors should remove the discrepancy between this model and actual ATP matches, allowing the model to more accurately price all main markets of a tennis match. Part two of this article will contain this analysis.
About the author