Related Articles

FiveThirtyEight are a well-known source of soccer predictions but how accurate are their predictions? How do they compare to Pinnacle’s betting odds? Do they provide any value to bettors? Read on to find out.
- The FiveThirtyEight football prediction model
- Can FiveThirtyEight’s prediction make a profit?
- What value does this provide to bettors?
A bookmaker’s odds essentially provide a direct forecast of the probability of sporting outcomes. When they are expressed in decimal notation, you simply invert the figure and you have your implied percentage (although there is a little bit of extra work involved to remove their margin). Odds of 2.50, for example (with the margin already removed) imply a 1/2.50, 0.4 or 40% outcome probability.
Of course, a bookmaker is not always right. Their mistakes provide opportunities for their customers to find expected value and make a long-term profit. Readers, however, will be familiar by now with my message that Pinnacle’s mistakes, for a soccer match betting market at least, are randomly distributed, and that on average their odds offer a very reliable reflection of the chances of things happening. In this context, their closing odds are the best of all, and can be used to predict how much profit a bettor can expect to make.
- Listen: Pinnacle betting podcast
However, there are other forecast groups who offer predictions about football match outcomes. One of the best known is Fivethirtyeight.com, the politics, economics and sports forecasting blog created by the American statistician, former poker player and author of The Signal and the Noise Nate Silver. Nate made a name for himself by successfully calling the outcomes of 49 of the 50 states in the 2008 US presidential election, and all 50 four years later.
From the perspective of the sports fan or bettor, FiveThirtyEight’s match forecastsare particularly useful because they explicitly offer the probabilities for home, draw and away. By inverting these we can immediately obtain their implied fair odds. The goal of any value bettor is to find fair odds that are more accurate than those of bookmaker. If they can, then it’s simply a matter of betting the bookmaker’s odds when those are longer. If the bettor is making a long-term profit, that’s a sure sign that they really have more accurate odds than the bookmaker. In this article I have collaborated with @PlusEVAnalytics to find out whether FiveThirtyEight can do the job.
The FiveThirtyEight football prediction model
FiveThirtyEight first started publishing football match predictions in January 2017, although their results database extends back to August 2016. Their methodology is based on a “substantially revised version of ESPN’s Soccer Power Index (SPI)” originally devised by Nate Silver, that utilises expected goals (or xG) and Poisson statistical analysis to generate a matrix of possible match scores, from which home, draw and away probabilities are calculated.
FiveThirtyEight think their soccer predictions are pretty good, arguing that they are more valuable than an unskilled guess. In that respect I am sure that they are right, but are they better than Pinnacle’s implied probabilities? Let’s find out.
Can FiveThirtyEight’s prediction make a profit?
Combining an historical Pinnacle closing odds database with the implied probabilities made available by FiveThirtyEight, I put together a sample of 16,635 matches from European soccer leagues played between 12th August 12, 2016 and March 31, 2019, for a total of 49,905 home/draw/away odds pairs.
On 20,093 occasions, Pinnacle’s closing odds were longer than those implied by FiveThirtyEight’s probability forecasts. The average superiority of those odds (average 4.12) was 16.2%, implying that had we bet those odds to level stakes we should have made a profit of about 16.2% assuming FiveThirtyEight’s odds, on average, to be an accurate or efficient reflection of the ‘true’ odds. In fact, they showed a loss of -6.0%, worse than the -4.3% loss betting all 49,905 prices (although not statistically significantly so).
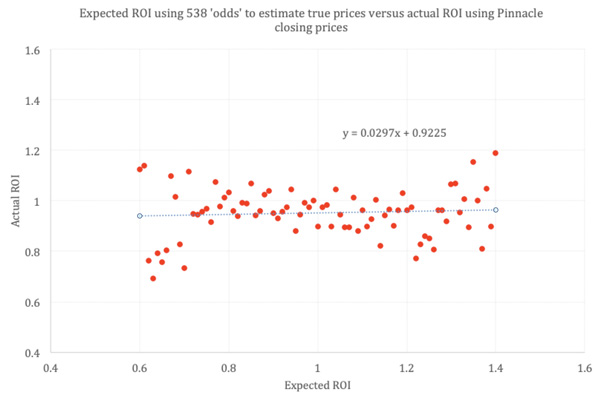
The first chart below shows how FiveThirtyEight’s implied odds failed to predict actual returns from betting Pinnacle’s closing odds. Dividing Pinnacle’s closing odds by FiveThirtyEight’s implied odds gives us an expected return for that bet, assuming the hypothesis that FiveThirtyEight’s odds are efficient is true.
Grouping bets by incremental expected returns (with a 0.01 resolution) we can see that expected returns fail to correlate with actual betting returns at all. Regardless of the ratio of Pinnacle’s closing odds to FiveThirtyEight’s implied odds, the average return is a loss of about -6%. It would seem FiveThirtyEight’s odds offer no predictive value at all, relative to Pinnacle’s closing odds.
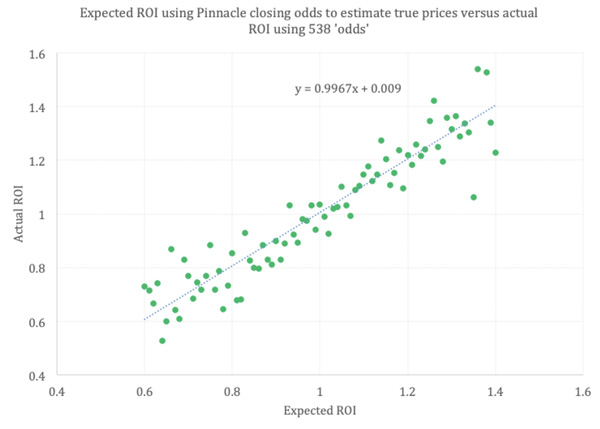
What if we turn things around? This time let’s pretend that FiveThirtyEight is the bookmaker and Pinnacle is the forecast model. Now the ratio of FiveThirtyEight’s odds to Pinnacle’s fair closing odds (with the margin removed) is used as the measure of expected return.
Betting FiveThirtyEight’s ‘odds’ on the 25,557 occasions they exceed Pinnacle’s fair closing odds, the actual return is 15.5%, very close to the average superiority of 15.9% (average odds 4.49). The scatter plot confirms the strong correlation between expected and actual returns for this reverse hypothesis. The slope of the trend line is almost exactly 1 and passing through the origin. (see the y = mx + c equation in the chart), implying that Pinnacle’s closing odds, on average, are highly efficient, not FiveThirtyEight’s.
Apples and Oranges
When I published these findings on my twitter feed in April it was rightly pointed out that we are comparing apples and oranges. FiveThirtyEight’s forecast probabilities are produced in advance of the fixtures, with their final probability estimate published after a team’s penultimate match has finished. This may be many days before the fixture in question. Their predictions can only be as good as the information that was available to them at the time.
Pinnacle’s closing odds, by contrast, will reflect all information available to the market right up to the point the match actually starts. This will include other factors like player injuries, changes to team selection, weather and the state of the pitch, things that FiveThirtyEight’s does not and cannot include.
To make a wholly fair model comparison with Pinnacle’s closing odds we would need FiveThirtyEight to issue probability forecasts at the same time, i.e. kick-off. That’s not going to happen. Alternatively, we could use Pinnacle’s odds at the time FiveThirtyEight issued their final forecast probabilities for a match. Unfortunately, I don’t have time-stamped data for Pinnacle’s odds and even if I did, I would imagine that the publication of their opening odds will often post-date the publication of FiveThirtyEight’s final forecasts.
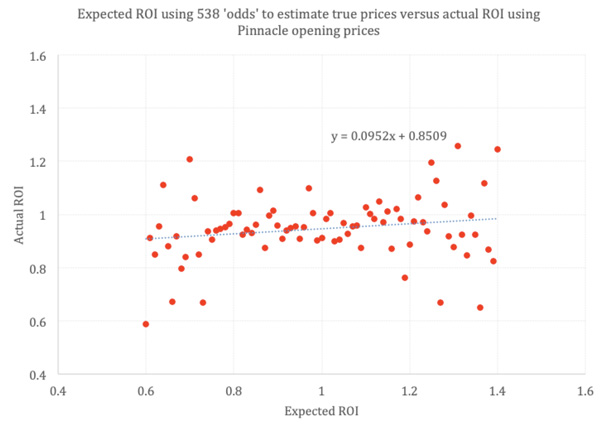
Nevertheless, using Pinnacle’s opening odds will potentially offer a fairer model comparison than their closing ones; let’s look at the results. For the 18,952 occasions Pinnacle’s opening odds were longer than for FiveThirtyEight (average 3.97) the average superiority of those odds was 14.2%, They showed a loss of -4.1%, marginally better (but not statistically significantly so) than the -4.4% loss betting all 49,905 prices. Again, there was little correlation between expected and actual returns.
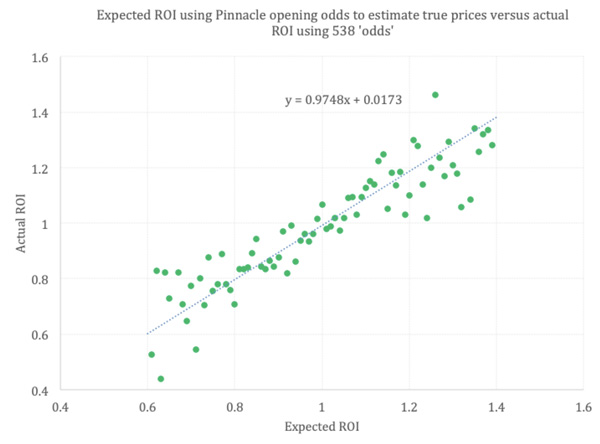
As before, when performing the model comparison in reverse (with Pinnacle’s opening odds used as the benchmark of ‘truth’), there was a much better correlation, not as precise as for the closing odds but still close to parity. Betting FiveThirtyEight’s ‘odds’ on the 25,775 occasions they exceed Pinnacle’s fair odds odds, the actual return is 12.8%, again reasonably close to the average superiority of 14.8% (average odds 4.54).
The Signal and the Noise
After posting the opening odds data on twitter, @PlusEVAnalytics, my co-author for this article, remarked that “if you’re asking yourself whether FiveThirtyEight is superior to Pinnacle, you’re going to get the obvious answer.”
Perhaps we are, and what we’ve found here is all rather self-evident. It is still probably true that FiveThirtyEight’s forecast probabilities will be informationally deficient relative to Pinnacle’s, both because of timing and because Pinnacle’s primary business model is to get their odds right, whilst FiveThirtyEight’s is simply to entertain. The latter doesn’t have to make money from its forecasts; well not directly anyway. To be fair, furthermore, FiveThirtyEight admit that their forecasts are not designed with betting in mind.
However, @PlusEVAnalytics proposed an interesting thought experiment. By combing the two forecast models to make a potentially better one than merely Pinnacle’s odds on their own we could uncover whether there was any signal in FiveThirtyEight’s forecasts residual to the signal in Pinnacle’s odds.
- Read: Why do we gamble?
The analysis thus far has been framed as an “either/or” proposition – which of the two predictions is a more accurate source of truth? The results are as conclusive as they are unsurprising. Now, let’s add a little twist by rephrasing the question as follows:
“Ultimate” probability of any given outcome = Z * (FiveThirtyEight’s probability of that outcome) + (1 – Z) * (Pinnacle’s probability of that outcome), for any given Z, 0 ≤ Z ≤ 1.
What value of Z maximises the predictive value of these ultimate probabilities?
This model is flexible enough to accommodate the construction of the ultimate probabilities using entirely FiveThirtyEight’s projections (by setting Z = 1), entirely Pinnacle’s projections (by setting Z = 0), as well as everything in between (by setting Z between 0 and 1).
How do we determine the best value of Z? There are several possible ways, but the one we’ll use here is maximum likelihood estimation (MLE). The purpose of MLE is to find the value(s) of one or more unknown parameters that provide the best “fit” to a set of observed data. How do we measure how good the fit is? By looking at the likelihood, conditional on the value of the unknown parameter, of observing exactly what we have observed.
Our model, defined above, has a single parameter – Z. Any given value of Z will allow us to calculate a set of ultimate home/draw/away probabilities, based on that value of Z, for each match in the data set. For each match, the likelihood of observing what we observed is our ultimate home/draw/away probability, if the result of the match was a home win/draw/away win. For example, for H/D/A probabilities of 0.5, 0.3 and 0.2, if the result is a draw, the likelihood of observing what we observed is 0.3.
Because all the matches are independent events, the likelihood of observing the exact set of outcomes that we observed is the product of the likelihoods from each individual match. This product is our objective – it’s what we are trying to maximise by adjusting Z.
Unfortunately, the product of 16,635 probabilities is infinitesimally small – think of it as a 16,635-leg parlay. This creates a computational problem when solving the MLE using a software tool such as Excel that is unable to handle small numbers beyond a certain threshold – anything smaller is rounded to zero.
To circumnavigate this problem, we can instead maximise the logarithm of the likelihood. Since the absolute value of the likelihood is irrelevant to the MLE procedure – what matters is how that likelihood changes as we adjust our parameters – maximizing the so-called “loglikelihood” is mathematically equivalent.
In addition to taking the logarithm of the ultimate match probabilities, we now also take the sum of the loglikelihoods rather than their product. Running this analysis on the data set gives the following results:
- When using Pinnacle’s closing odds, loglikelihood is maximised when Z = 0. In other words, FiveThirtyEight contributes effectively nothing to the “ultimate” forecast model when considering just FiveThirtyEight and Pinnacle forecasts.
- When using Pinnacle’s opening odds, loglikelihood is maximised when Z = 0.04. In other words, FiveThirtyEight contributes about 4% to the “ultimate” model.
The wisdom of models
It is the second of these two results that is interesting. When forced to choose one or the other, Pinnacle’s opening lines provide predictive value that is objectively far superior to FiveThirtyEight’s predictions. But here’s the twist…
A weighted average made up of 4% x FiveThirtyEight’s prediction + 96% x Pinnacle’s opening line provides better predictive value than either of the two predictions does individually!
What value does this provide to bettors? Practically, not much. The 4% is too small to be of much use, and it may not even be statistically significant. But what if Z was larger? And, what if instead of two predictions there were many, with each one getting its own Z? This is a variation of the “wisdom of crowds” theory, which states that a combination of separate predictions put together can be more valuable than even the best of those predictions by itself.
Essentially, this is what makes Pinnacles odds so accurate (on average). They have the most sophisticated and knowledgeable traders setting lines. They also allow other sharp bettors to play rather than refusing their custom, thereby helping adjust their lines to become ever more accurate or wise. Pinnacle’s closing odds effectively represent a “wisdom of forecast models” and their odds reflect the “ultimate” outcome probabilities. And that is probably why FiveThirtyEight never stood a chance against them.
About the author